Figure 1.
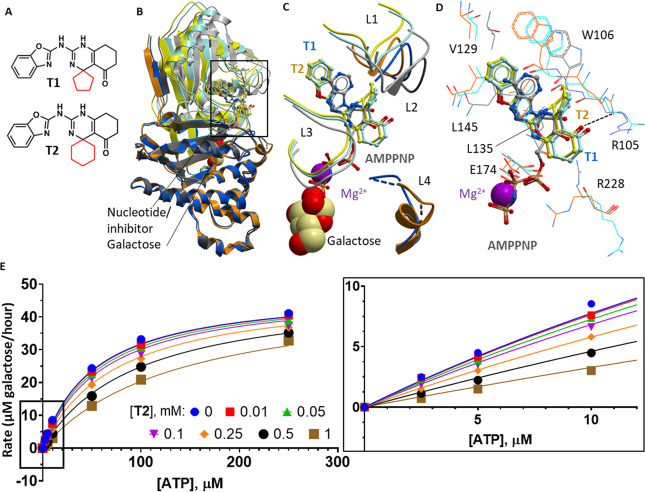
Structural and kinetic characterization of spiro-benzoxazole inhibitors of GALK1. (A) Chemical structures of the two spiro-benzoxazole inhibitors characterized in this work. The spiro-ring, differing between the two compounds, is highlighted in red. (B) Superimposed structures of GALK1-galactose-AMPPNP (PDB 1WUU; light/dark gray), GALK1-galactose-T1 (light/dark blue), and GALK1-galactose-T2 (yellow/orange) structures. The N-terminal domain is shaded lighter than the C-terminal domain. Galactose and magnesium are shown as spacefill; AMPPNP, T1, and T2 are shown as gray, blue, and yellow sticks, respectively. (C) Close-up view of the boxed area shown in panel B. The four ATP binding loops (L1, Ser79–Pro85; L2, Ser98–Arg105; L3, Val133–Ser140; and L4; Arg228–Glu235) are shown as ribbons. Galactose and magnesium ions are shown as spacefill, and AMPPNP, T1, and T2 are shown as gray, blue, and yellow sticks, respectively. (D) Close-up view of the GALK1 active site illustrating the binding mode of AMPPNP, T1, and T2. Nearby protein residues of the GALK1–galactose–AMPPNP, GALK1–galactose–T1, and GALK1–galactose–T2 structures are shown as gray, blue, and orange lines, respectively. (E) Least-squares nonlinear fit of GALK1 reaction rate (total galactose consumed after 1 h reaction, μM) against increasing ATP concentrations (0–250 μM) in the presence of different concentrations of the inhibitor T2 (0–1 mM). Curves were fitted to the competitive inhibition model, the best fitting enzyme kinetics–inhibition equation, using the GraphPad Prism software. Inset: Close-up view of plot showing GALK1 reaction rate (total galactose consumed after 1 h reaction, μM) against increasing ATP concentrations (0–10 μM) in the presence of different concentrations of the inhibitor T2 (0–1 mM).

