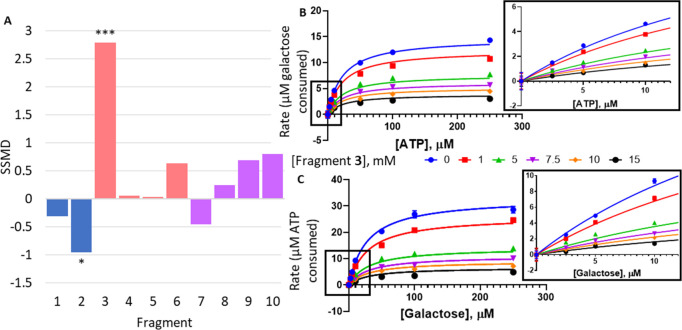
Figure 3.
Change in hGALK1 activity in the presence of fragments. (A) Bar chart showing the observed change in hGALK1 activity in the presence of 5 mM fragment, as measured in the Kinase-Glo assay. Change in activity is reported as strictly standardized mean difference (SSMD), and P values are also indicated: *P < 0.05, ***P < 0.0001. (B) Least-squares nonlinear fit of GALK1 reaction rate (total galactose consumed after 1 h reaction, μM) against increasing ATP concentrations (0–250 μM) in the presence of different concentrations of fragment 3 (0–15 mM). Curves were fitted to a noncompetitive inhibition model, the best fitting enzyme kinetics–inhibition equation, using the GraphPad Prism software. Inset: Close-up view of plot showing GALK1 reaction rate (total galactose consumed after 1 h reaction, μM) against increasing ATP concentrations (0–10 μM) in the presence of different concentrations of fragment 3 (0–15 mM), as determined in the Amplex Red assay. (C) Least-squares nonlinear fit of GALK1 reaction rate (total ATP consumed after 1 h reaction, μM) against increasing galactose concentrations (0–250 μM) in the presence of different concentrations of fragment 3 (0–15 mM). Curves were fitted to a noncompetitive inhibition model, the best fitting enzyme kinetics–inhibition equation, using the GraphPad Prism software. Inset: Close-up view of plot showing GALK1 reaction rate (total ATP consumed after 1 h reaction, μM) against increasing galactose concentrations (0–10 μM) in the presence of different concentrations of fragment 3 (0–15 mM), as determined in the Kinase-Glo assay.

