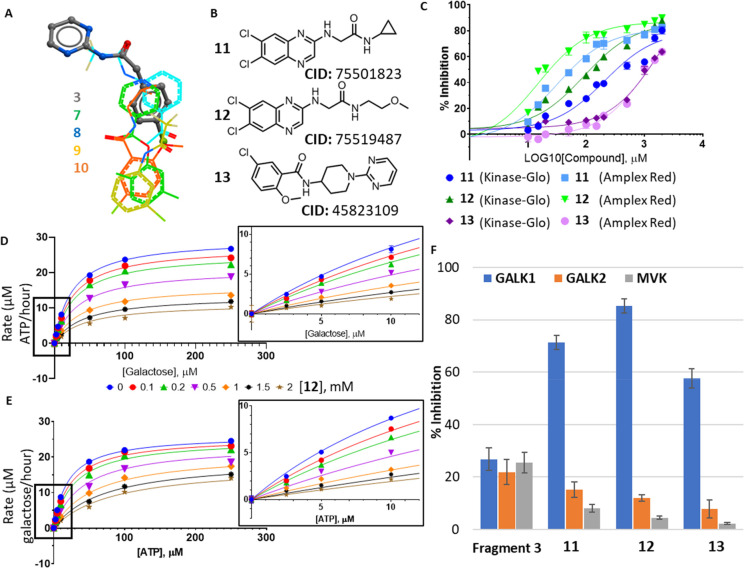
Figure 4.
Follow-up compounds based on hotspot fragments. (A) Ligand view of superimposed fragment structures at the binding hotspot. Fragment 3 from the upper cluster is shown as sticks, and fragments 7–10 from the lower cluster are shown as lines. (B) Chemical structures and chemical IDs of follow-up compounds 11–13. (C) Concentration–response curves for compounds 11 (blue), 12 (green), and 13 (purple) as measured in the Kinase-Glo assay (dark shades) and the Amplex Red assay (light shades). (D) Least-squares nonlinear fit of GALK1 reaction rate (total ATP consumed after 1 h reaction, μM) against increasing galactose concentrations (0–250 μM) in the presence of different concentrations of 12 (0–2 mM). Curves were fitted to a noncompetitive inhibition model, the best fitting enzyme kinetics–inhibition equation, in GraphPad Prism. Inset: Close-up view of plot showing GALK1 reaction rate (total ATP consumed after 1 h reaction, μM) against increasing galactose concentrations (0–10 μM) in the presence of different concentrations of 12 (0–2 mM), as determined in the Kinase-Glo assay. (E) Least-squares nonlinear fit of GALK1 reaction rate (total galactose consumed after 1 h reaction, μM) against increasing ATP concentrations (0–250 μM) in the presence of different concentrations of 12 (0–2 mM). Curves were fitted to noncompetitive inhibition model, the best fitting enzyme kinetics–inhibition equation, in GraphPad Prism. Inset: Close-up view of plot showing GALK1 reaction rate (total galactose consumed after 1 h reaction, μM) against increasing ATP concentrations (0–10 μM) in the presence of different concentrations of 12 (0–2 mM), as determined in the Amplex Red assay. (F) Bar chart comparing % inhibition of hGALK1 (blue), hGALK2 (orange), and hMVK (gray) by 5 mM of fragment 3 or 1 mM of 11–13.

