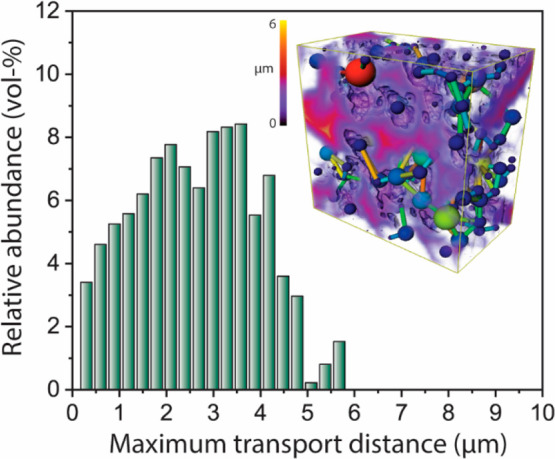
Figure 2.

Histogram for the maximum Euclidean distance from mesopore regions to the nearest boundary with the macropore network as derived from 3D image analysis of the reconstructed FIB-SEM tomogram for the bimodally meso-macroporous γ-Al2O3 support material (AOmM). The inset shows the 3D contour plot for the Euclidean distance to nearest macropore as well as the computed Pore Network Model, with macropores shown as balls and throats connecting them as bars. See details for the 3D tomographic image quantification in the Supporting Information.
