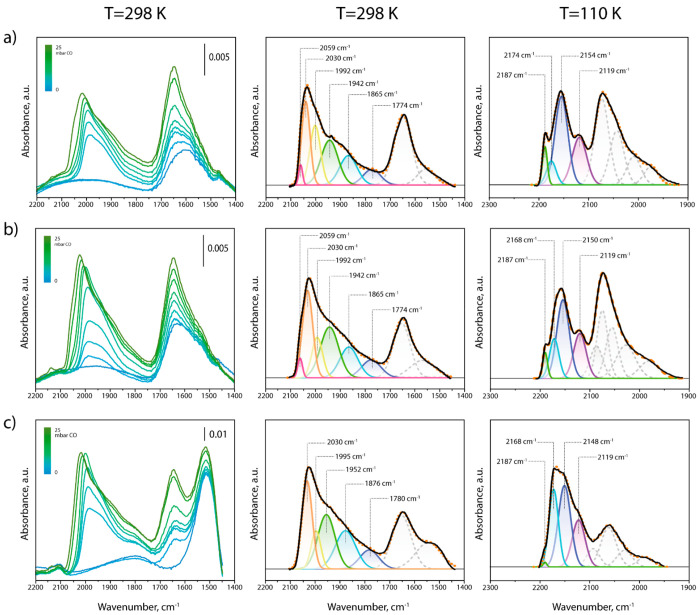
Figure 7.
In situ CO-FTIR investigation on promoter effects. FTIR spectra recorded at 298 K in the υ(CO) region after increasing CO doses in the range PCO = 0–25 mbar (left); deconvolution of the FTIR spectrum recorded at 298 K after having dosed ca. 25 mbar CO (center); and deconvolution of the FTIR spectrum recorded at 110 K after having dosed 2 mbar CO (right, see Figure S20 in the Supporting Information for the full set of spectra at increasing pCO = 0–2 mbar), on the in situ reduced (a) CoRu/AOmM, (b) 1.0Pr-CoRu/AOmM, and (c) 3.0Pr-CoRu/AOmM catalysts.

