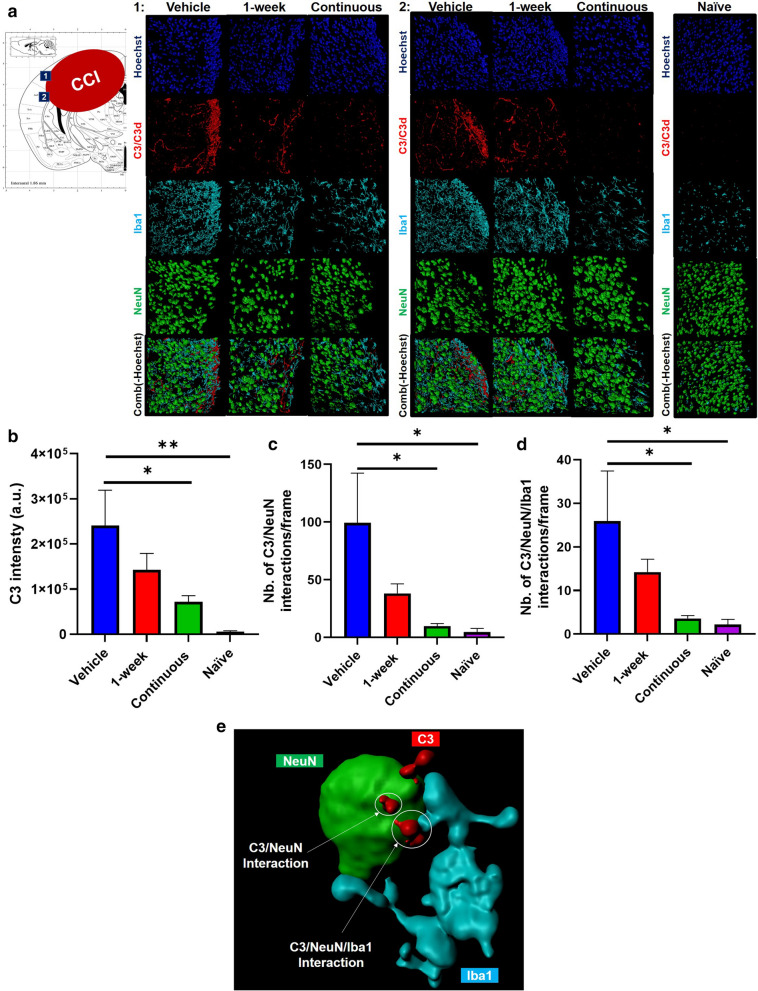
Fig 3.
Complement C3 deposition decreases with continuous CR2Crry treatment. a Representative Imaris images of processed 40x z-stacked immunofluorescence images acquired by confocal microscopy from two regions adjacent to site of TBI impact (as shown in the atlas image represented in this figure) from vehicle treatment, 1-week CR2Crry treatment, continuous CR2Crry treatment, and naïve mice (9 months). Hoechst (blue), C3 (red), NeuN (green), and Iba-1 (aqua). b Quantification of C3 intensity. c Quantification of number of C3/NeuN interactions per frame. d Quantification of number of C3/NeuN/Iba1 interaction per frame. One-way ANOVA with Bonferroni correction for multiple comparisons. Unpaired T-test: continuous vs. vehicle. Error bars = Mean +/- SEM. *p < 0.05, **p < 0.01. n = 6–9/group. e 3D representative example of interactions (white arrows) between C3 (red)/ NeuN (green) and C3 (red)/ NeuN (green)/ Iba1 (aqua).

