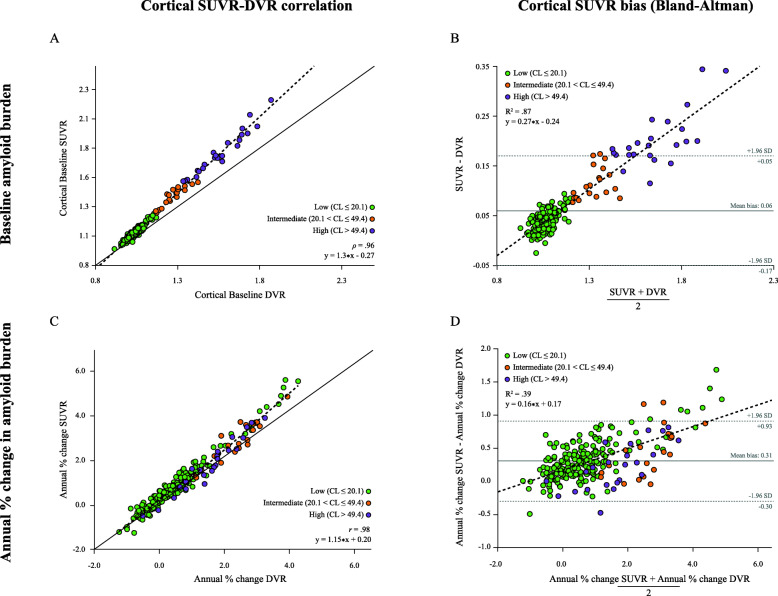
Fig. 1.
Relationship between SUVR and DVR. On the top panel, a scatterplot between baseline cortical SUVR and DVR across all subjects, with a solid identity line as reference (a), and a Bland-Altman plot displaying a linear relationship between SUVR bias and underlying amyloid burden (b). On the bottom panel, a scatterplot between annualized % cortical SUVR and DVR across all subjects, with a solid identity line as reference (c), and a Bland-Altman plot displaying a linear relationship between bias in annualized % cortical SUVR and underlying accumulation rates, with a dotted line representing a linear regression through the data points (d)

