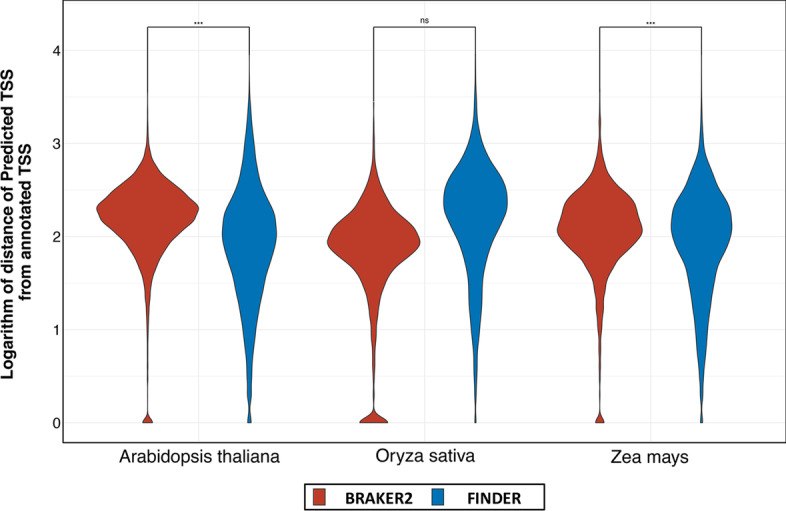
Fig. 6.

Comparison of distance between transcription start sites of gene models predicted by BRAKER2 and FINDER. Violin plots of the distribution of the distance between the actual transcription start site (TSS) and the predicted transcription start site. In a set of well annotation complete gene structures, a higher fraction of genes is expected to have low deviation from the actual TSS. We considered genes that were reported in either BRAKER or FINDER for this analysis. Wilcoxon’s rank sum test was used to compare the TSS distances between FINDER and BRAKER2. The “***” symbol implies that TSS distance for FINDER gene models was significantly less than BRAKER2 gene models. (Generated using ggplot2 v3.3.3)
