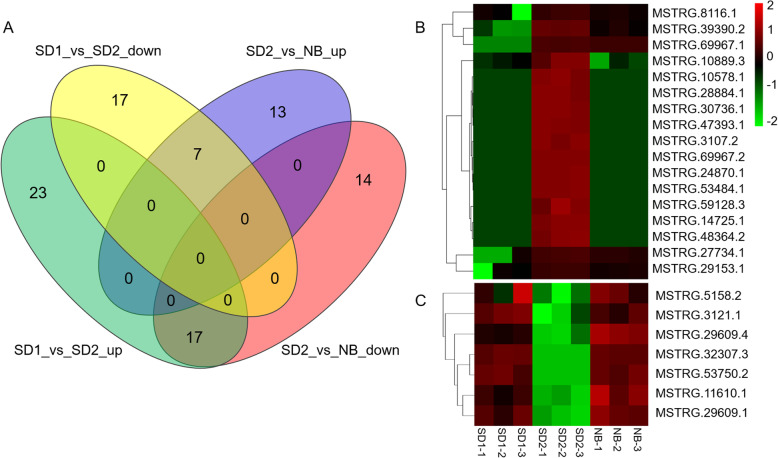
Fig. 6.
Identification and expression analysis of the putative positive and negative flowering lncRNAs. a Venn diagram showing the number of specific and common differentially expressed lncRNAs in comparisons of SD1_vs_SD2 and SD2_vs_NB. The 17 DE lncRNAs showing up-regulation in SD1_vs_SD2 but down-regulation in SD2_vs_NB were predicted to be putative positive flowering lncRNAs. The 7 DE lncRNAs showing down-regulation in SD1_vs_SD2 but up-regulation in SD2_vs_NB were predicted to be putative negative flowering lncRNAs. Heatmap showing the expression levels (log10FPKM) of putative positive (b) and negative (c) flowering lncRNAs in different samples

