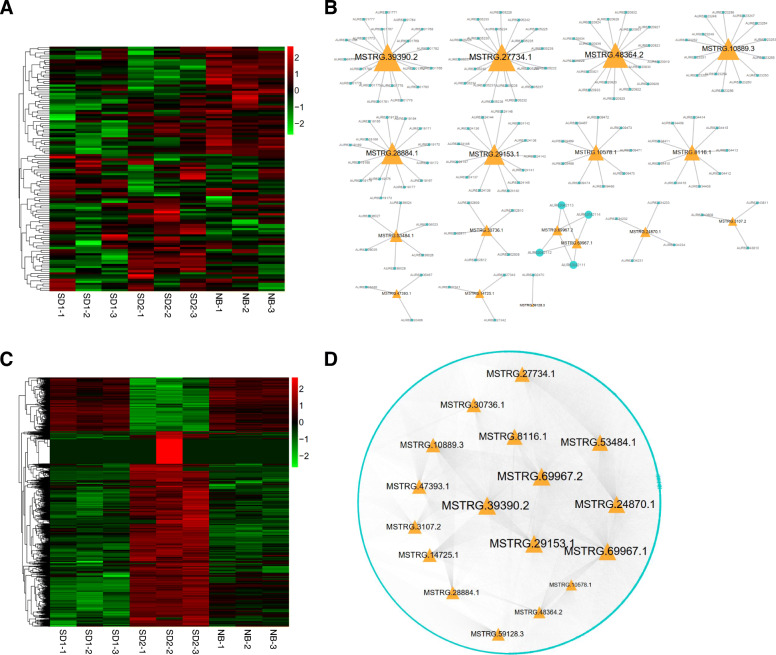
Fig. 7.
Expression and regulatory network analysis of the cis and trans targets of positive flowering lncRNAs. a Heatmap showing the expression levels (log10FPKM) of the cis targets in different samples. b Relationship between the positive flowering lncRNAs and their co-located cis targets. c Heatmap showing the expression levels (log10FPKM) of the trans targets in different samples. d Co-expression network analysis of the positive flowering lncRNAs and their trans targets. The orange triangles and light-blue circles stand for lncRNAs and mRNA targets, respectively. The node and font size reflect the degrees between lncRNAs and their targets

