FIGURE 1.

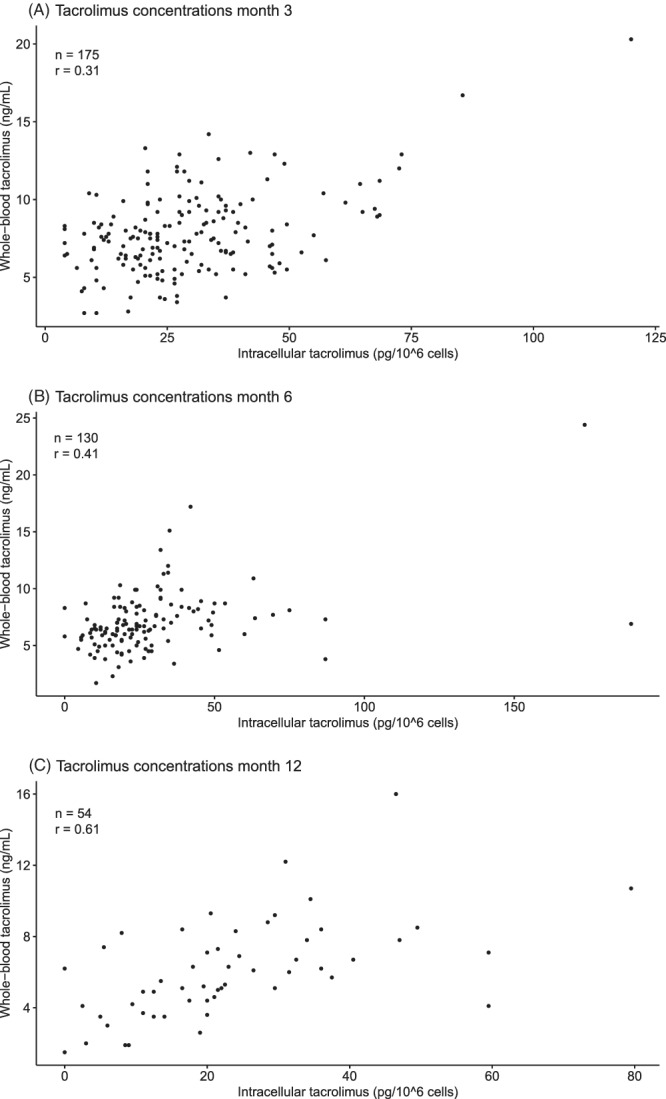
Scatter plots illustrating the distribution of whole‐blood and PBMC tacrolimus concentrations in the 3rd (A), 6th (B) and 12th (C) month after transplantation with Spearman's correlation coefficient

Scatter plots illustrating the distribution of whole‐blood and PBMC tacrolimus concentrations in the 3rd (A), 6th (B) and 12th (C) month after transplantation with Spearman's correlation coefficient