Figure 4.
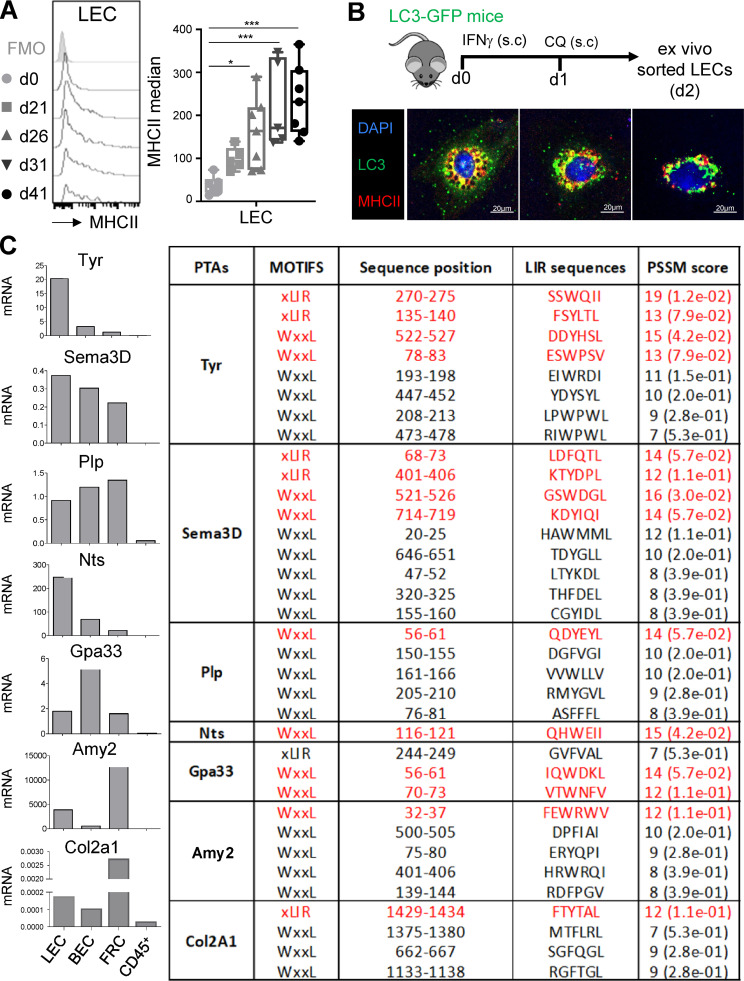
Contribution of autophagy to MHCII-restricted presentation of PTA by LECs. (A) CIA was induced in WT mice, and MHCII expression levels were assessed by flow cytometry in dLN LECs at indicated time points. Data represent MHCII expression levels (median–FMO) and are representative of two independent experiments with four or five mice for each time point. One-way ANOVA; * P < 0.05 and *** P < 0.001. Error bars correspond to lower and higher values for each group. (B) LC3-GFP mice were injected s.c. with IFN-γ and CQ. LECs were sorted from dLNs, and colocalization of autophagosomes (LC3-GFP+ organelles) and MHCII compartment was examined by microscopy. (C) Pattern of indicated PTA mRNA expressed by LECs, BECs, and FRCs sorted from steady-state LNs (pool of three or four mice) and PSSM scores of their amino acid sequences determining their potential targeting toward autophagosomes (iLIR database software).

