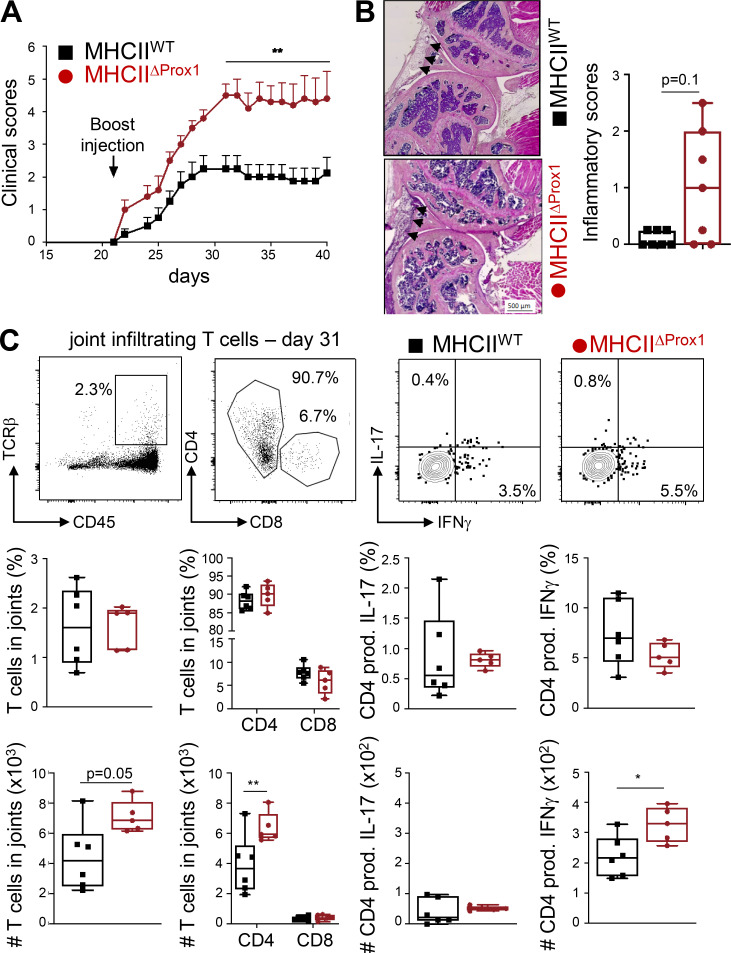
Figure 5.
Abolition of MHCII in LECs exacerbates CIA. (A–C) CIA was induced in Tx-treated MHCIIWT and MHCIIΔProx1 mice. (A) Clinical scores (paw thickness) were assessed at indicated time points. Data are representative of two independent experiments with six to eight mice/group. (B) Inflammatory scores were assessed by histological analysis on knee sections at day 41 (seven or eight mice/group). Representative images are provided, and arrowheads indicate areas of inflammation. Histograms represent global inflammation scores (sum of two knees per mouse). (C) Flow cytometry analysis of indicated T cell subsets infiltrating hind-joint legs at day 31, five or six mice/group. Representative dot plots are provided. Histograms represent the frequencies or the numbers of indicated cells in joints. Two-way ANOVA (A) and unpaired t test (B and C); * P < 0.05 and ** P < 0.01. Error bars correspond to SEM (A) and to lower and higher values for each group (B and C).

