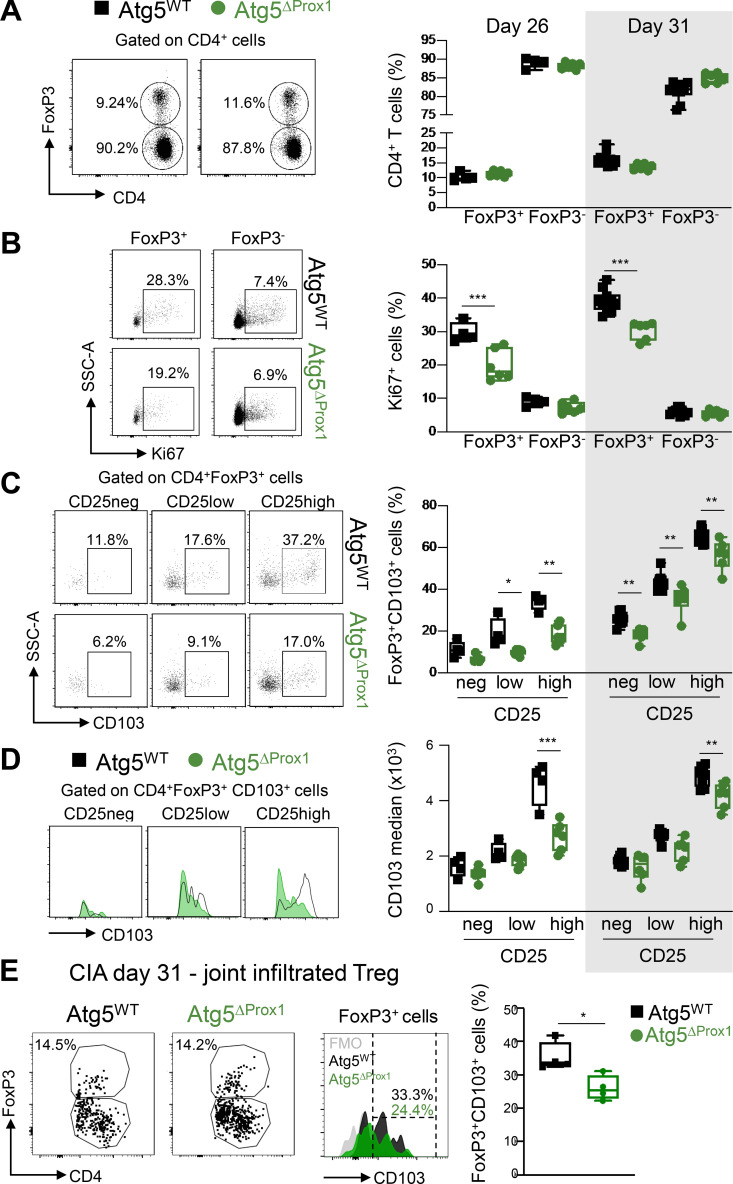
Figure 6.
Abolition of autophagy in LECs alters LN T reg cells during CIA. (A–E) CIA was induced in Tx-treated Atg5WT and Atg5ΔProx1 mice. (A and B) Flow cytometry analysis of T reg cells (FoxP3+CD4+ cells) and T conv cells (FoxP3−CD4+ cells) in dLNs at days 26 and 31. Cell frequency (A) and proliferation rate (Ki67+; B) in the CD4+ T cell population. (C and D) CD103 frequencies (C) and median (D) among T reg cells (CD4+FoxP3+; C) and CD103+ T reg cells (CD4+FoxP3+CD103+; D), CD25 negative (neg), or expressing low or high levels of CD25 in dLNs at days 26 and 31. Data are representative of two experiments with five or six mice/group each. (E) FoxP3+ frequency among CD4+ T cells and CD103 expression levels (median) among FoxP3+CD4+ T cells at day 31. Data are from one experiment with four or five mice/group. Unpaired t test (A and B) and two-way ANOVA (C and D). * P < 0.05, ** P < 0.01, and *** P < 0.001. (A–E) Error bars correspond to lower and higher values for each group.

