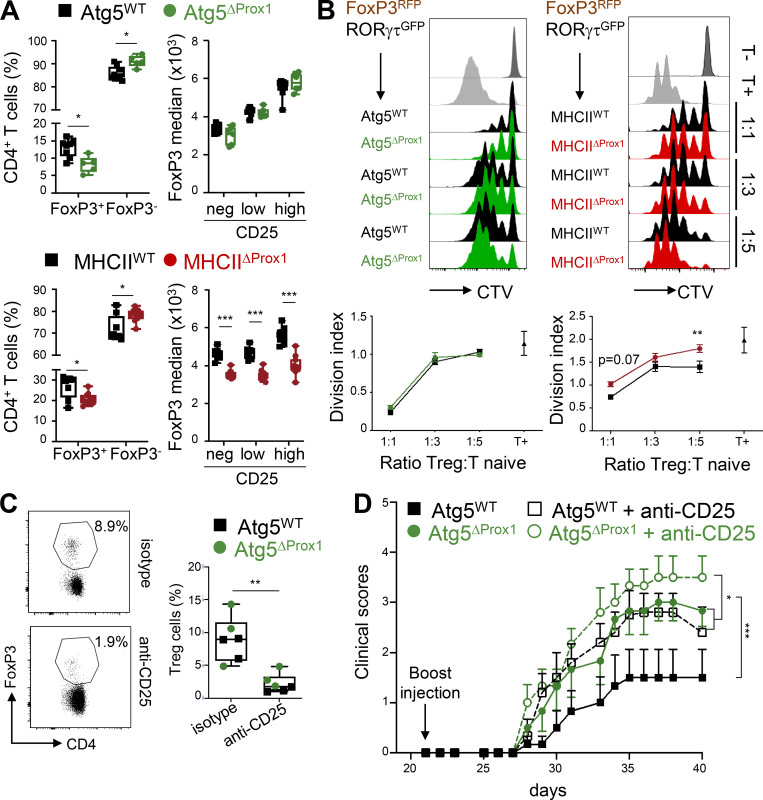
Figure 7.
Abolition of MHCII but not autophagy in LECs impairs intrinsic T reg cell suppressive functions during CIA. (A) CIA was induced in Tx-treated MHCIIWT and MHCIIΔProx1 or Atg5WT and Atg5ΔProx1 mice. FoxP3+ and FoxP3− frequencies among CD4+ T cells as well as FoxP3 expression levels (median) among T reg cells (CD4+FoxP3+), CD25 negative (neg), or T reg cells expressing low or high levels of CD25 were assessed in dLNs from Tx-treated Atg5WT and Atg5ΔProx1 mice and MHCIIWT and MHCIIΔProx1 mice at late time point after CIA induction (day 50 and day 41, respectively). (B) CIA was induced in Tx-treated FoxP3RFPRORγtGFP→Atg5ΔProx1, Atg5WT, MHCIIΔProx1, and MHCIIWT BM-chimeric mice. T reg cells (FoxP3RFP) were sorted at day 26 and co-cultured at indicated ratio with CTV-labeled CD4+CD25neg cells stimulated with anti-CD3 antibodies and BM-derived DCs. After 3 d, the division index of CTV-labeled CD4+CD25neg cells was analyzed by flow cytometry. (A and B) Data are representative of two independents experiments, six or seven mice/group. (C and D) CIA was induced in Tx-treated Atg5WT and Atg5ΔProx1 mice and treated or not treated with depleting anti-CD25 antibodies. (C) CD4+FoxP3+ cell depletion was assessed in blood by flow cytometry at day 25. (D) Clinical scores (paw thickness) were assessed at indicated time points, six mice/group. Multiple t test comparison corrected using Sidak-Bonferroni method for T reg cell frequencies and two-way ANOVA for median of FoxP3 (A), two-way ANOVA (B and D), and unpaired t test (C). * P < 0.05, ** P < 0.01, and *** P < 0.001. Error bars correspond to lower and higher values for each group (A and C) and to SEM (B and D).

