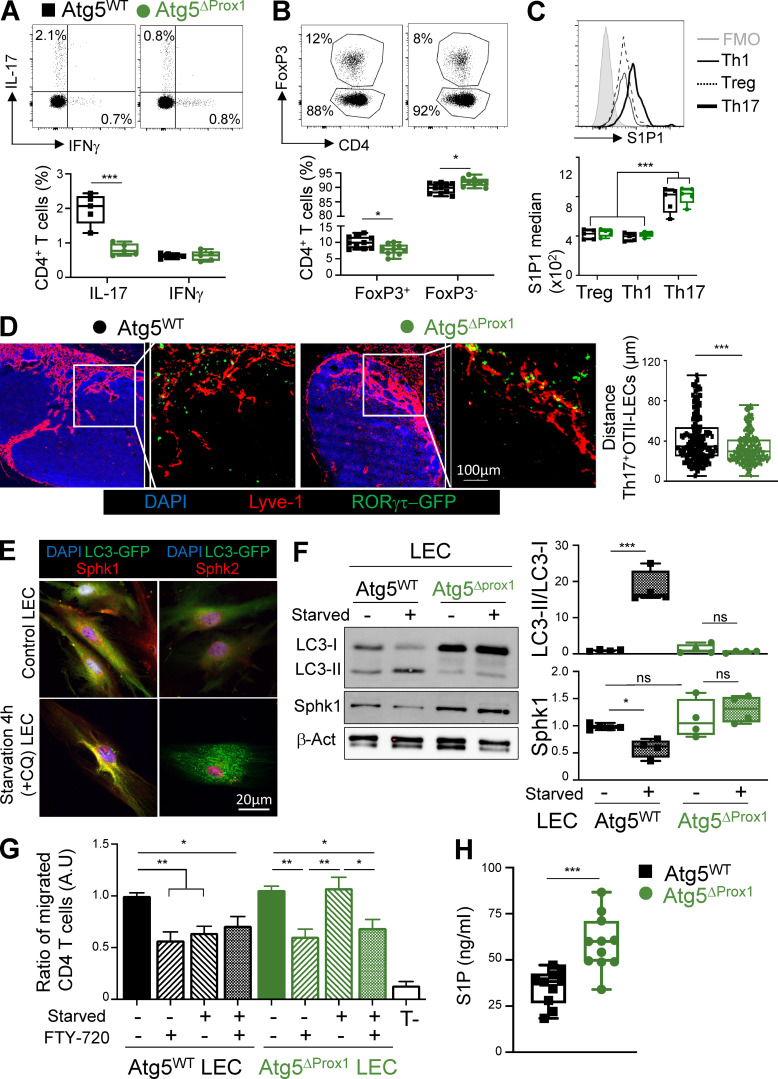
Figure 9.
Autophagy controls LEC ability to regulate effector T cell migration by inducing SphK1 degradation and decreasing S1P production. (A–C) Tx-treated Atg5WT and Atg5ΔProx1 mice were immunized with OVAII/CFA. 5 d later, IFN-γ–producing (Th1), IL-17–producing (Th17) CD4+ T cell frequencies (A), Foxp3+ (T reg cell) CD4+ T cell frequencies (B), and S1P1 expression levels (median) in T reg, Th1, and Th17 cells (C) were determined by flow cytometry. Data are representative of two independent experiments with five or six mice/group. (D) Tx-treated Atg5WT and Atg5ΔProx1 mice were adoptively transferred with RORγtGFPFoxP3RFP OT-II T cells and immunized with OVAII/CFA the day after. 5 d later, distances between RORγt-GFP+ Th17 cells and Lyve1+ LECs were calculated on LN sections, four or five mice/group. (E) SphK1, SphK2, and autophagosome (LC3-GFP+ organelles) staining in LECs sorted from LC3-GFP mice cultured and starved or not in HBSS+CQ for 4 h. Data are representative of three independent experiments with two or three mice/group. (F) SphK1 protein levels and LC3-II/LC3-I ratios (fold change) on sorted LECs from Tx-treated Atg5WT and Atg5ΔProx1 mice, cultured and starved or not for 4 h. Data are representative of three independent experiments with two or three mice/group. (G) LECs sorted from Tx-treated Atg5WT and Atg5ΔProx1 mice were cultured in the bottom part of a transwell membrane and starved or not for 16 h. Activated CD4+ T cells, treated or not treated with FTY-720, were added in the upper part. After 4 h, CD4+ T cell transmigration was analyzed by flow cytometry in the bottom part. Results are expressed as the ratio of migrated CD4+ T cells normalized to the control group (nonstarved WT LECs without FTY-720). Data are representative of three independent experiments with three or four mice/group. (H) S1P quantification (ELISA) from sorted Tx-treated Atg5WT and Atg5ΔProx1 LECs cultured in RPMI with 1% of BSA (FBS free) for 48 h (two independent experiments with five or six mice/group). Unpaired t test (A, B, and H), one-way ANOVA (C, F, and G), and Kruskal Wallis (D). * P < 0.05, ** P < 0.01, and *** P < 0.001. Error bars correspond to lower and higher values for each group (A–D, F, and H) and to SEM (G).

