Figure 1.
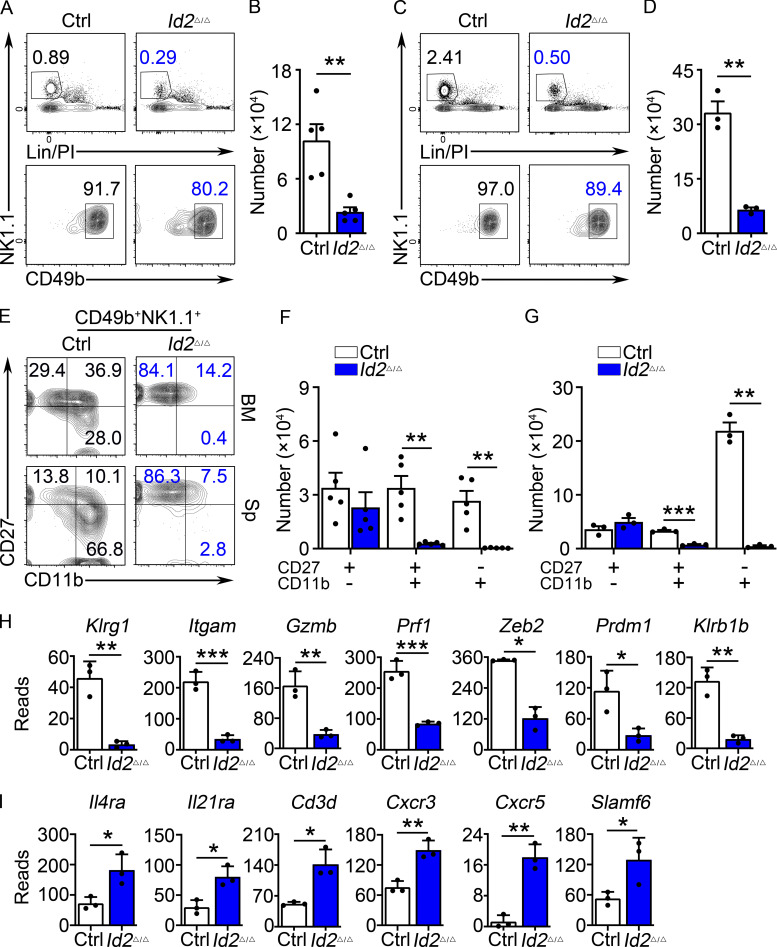
Arrested NK cell maturation in Id2Δ/Δ mice. (A) Flow cytometry showing gating strategy for BM NK cells in Ctrl and Id2Δ/Δ mice. Top panels show lineage (Lin; CD3e)/PI versus NK1.1 on lymphoid cells in the BM. Lower panels show NK1.1 versus CD49b on Lin/PI-NK1.1+ cells. The percentage of cells in the gate is indicated. (B) Summary of the number of NK cells per 108 BM cells. Bar represents the average ± SEM. Ctrl (white) and Id2Δ/Δ (blue). Each circle represents one mouse. (C) Same as A but for spleen. (D) Same as B but for spleen. (E) CD49b+NK1.1+ NK cells from the BM (top) or spleen (bottom) were examined for expression of CD27 and CD11b by flow cytometry. The percentage of cells in each quadrant is indicated. (F and G) Summary of the number of CD27+CD11b−, CD27+CD11b+, and CD27−CD11b+ NK cells per 108 BM cells or per spleen (n = 5 for BM and n = 3 for spleen [Sp]; data are from independent experiments). (H and I) RNA expression for the indicated genes in Ctrl or Id2Δ/Δ determined by RNA-seq and expressed as normalized reads. Data are from three biological replicates. Error bars represent SD. Statistical significance was determined by two-tailed unpaired t test. *, P < 0.05; **, P < 0.01; ***, P < 0.005.

