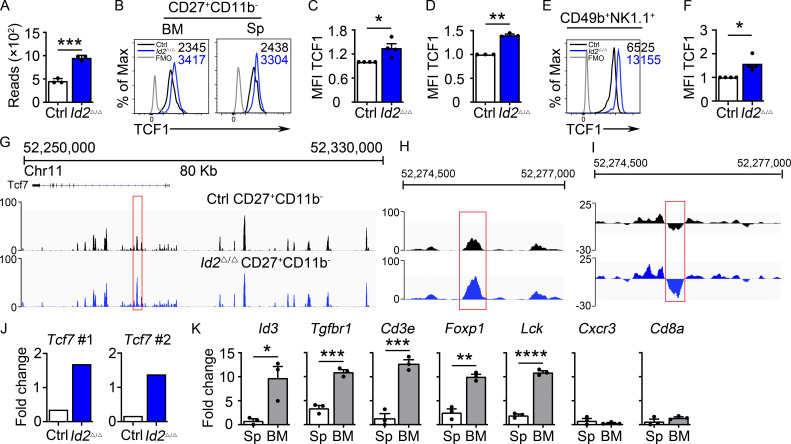
Figure 2.
Dysregulation of Tcf7/TCF1 in Id2Δ/Δ NK cells. (A) Tcf7 mRNA in Ctrl and Id2Δ/Δ NK cells by RNA-seq expressed as normalized reads. Data are from three biological replicates. Error bars represent SD. (B) TCF1 in CD27+CD11b− NK cells from BM and spleen from Ctrl and Id2Δ/Δ mice determined by flow cytometry. The MFI of TCF1 is indicated for Ctrl (black) and Id2Δ/Δ (blue; n = 4 for BM and n = 3 for spleen; data are from independent experiments). (C and D) Summary of relative TCF1 MFI from BM and spleen. MFI of Ctrl NK cells was set as 1 in each experiment. (E) CD49b+-enriched BM NK cells were cultured in IL-15 (20 ng/ml) for 6 d before flow cytometry analysis for TCF1 in NK1.1+CD49b+ cells. The MFI for TCF1 in Ctrl (black) and Id2Δ/Δ (blue) is shown. (F) Summary of relative TCF1 MFI in IL-15–cultured NK cells. MFI of Ctrl NK cells was set as 1 in each experiment (n = 4; data are from independent experiments). Error bars represent SEM (C, D, and F). (G) Chromatin accessibility surrounding the Tcf7 gene as determined by ATAC-seq on CD27+CD11b− NK cells (Zook et al., 2018). Ctrl (black) and ID2-deficient (blue) NK cells. (H) Enhanced view of the indicated region of the Tcf7 intron showing increased chromatin accessibility in ID2-deficient CD27+CD11b− NK cells. (I) The same region as in H but showing nucleosome depletion. (J) E protein ChIP was performed on chromatin isolated from Ctrl or Id2Δ/Δ BM NK cells and amplified using two different primer sets flanking the region shown in H. Data are represented as the signal relative to input and are representative of two independent experiments with triplicate measurements. (K) TCF1 ChIP was performed on chromatin isolated from spleen (Sp) or BM NK cells and represented as the signal at the indicated gene relative to input. Data are representative of two experiments with triplicate samples. Statistical significance was determined using a two-tailed unpaired t test (A, D, and F). *, P < 0.05; **, P < 0.01; ***, P < 0.005; ****, P < 0.001.

