Figure 5.
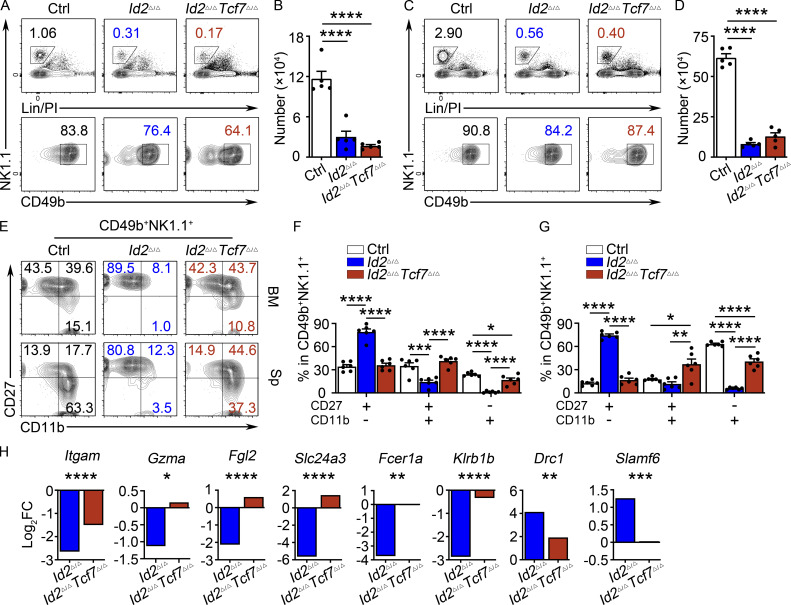
TCF1 is required for the arrested maturation of Id2Δ/Δ NK cells. (A and C) BM and spleen from Id2Δ/ΔTcf7Δ/Δ, Id2Δ/Δ, and Ctrl mice were analyzed by flow cytometry for NK cells. The top panels show lineage (Lin) + PI versus NK1.1+ on lymphoid cells, and the bottom panels show NK1.1 versus CD49b on Lin/PI−NK1.1+ NK cells. Numbers are the percentage of cells in the indicated gates (n = 5). (B and D) Summary of data shown in A and C, respectively, for NK cell numbers per 108 cells. (E) CD49b+NK1.1+ NK cells from BM (top) and spleen (Sp; bottom) were analyzed by flow cytometry for CD27 and CD11b. Numbers indicate the percentage of cells in the respective quadrant (n = 6). (F and G) Summary of data shown in E for BM(F) and spleen (G) for frequencies of different NK cell subsets. Error bars represent SEM (B, D, F, and G). Statistical significance was determined by one-way ANOVA with Tukey’s multiple comparisons test (B, D, F, and G). (H) Log2FC for Id2Δ/Δ/Ctrl or Id2Δ/ΔTcf7Δ/Δ/Ctrl determined from RNA-seq. Data are from comparisons of three biological replicates. Statistical significance determined after adjustment for multiple comparisons. *, P < 0.05; **, P < 0.01; ***, P < 0.005; ****, P < 0.001.

