Figure 6.
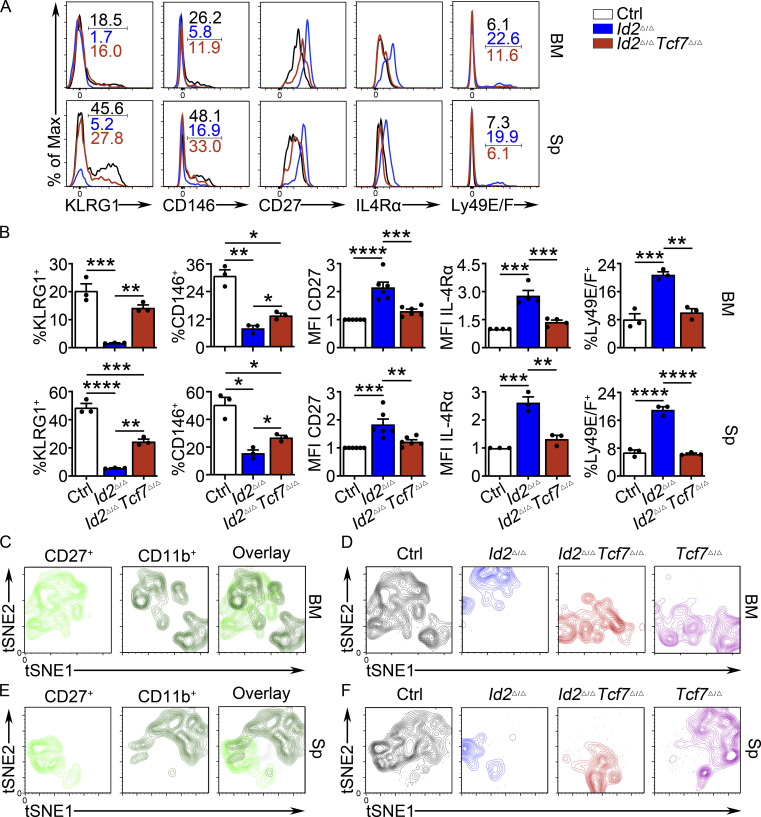
TCF1 deficiency restores NK cell surface receptor expression in Id2Δ/Δ NK cells. (A) Flow cytometry plots of different receptors on NK cells of BM (top) and spleen (Sp; bottom) from Id2Δ/ΔTcf7Δ/Δ (red), Id2Δ/Δ (blue), and Ctrl (black) mice. Numbers are the percentage of cells in the indicated gates. Data represent three to six independent experiments (n = 3–6 for each group). (B) Summary of data shown in A. MFI of Ctrl NK cells was set as 1 in each experiment for CD27 and IL-4Rα. Error bars represent SEM. Statistical significance was determined by one-way ANOVA with Tukey’s multiple comparisons test. *, P < 0.05; **, P < 0.01; ***, P < 0.005; ****, P < 0.001. (C and E) BM and spleen tSNE analysis showing expression of CD27 or CD11b on Ctrl NK1.1+CD49b+ NK cells and the overlay of the two markers. Data are representative of two experiments. (D and F) BM and spleen tSNE analysis on NK1.1+CD49b+ NK cells for each of the indicated genotypes. Plots were generated using surface receptors (NK1.1, CD49b, CD27, CD11b, CD49a, KLRG1, CD146, SLAMF6, CD226, IL4Ra, and CXCR3). Data are representative of two experiments.

