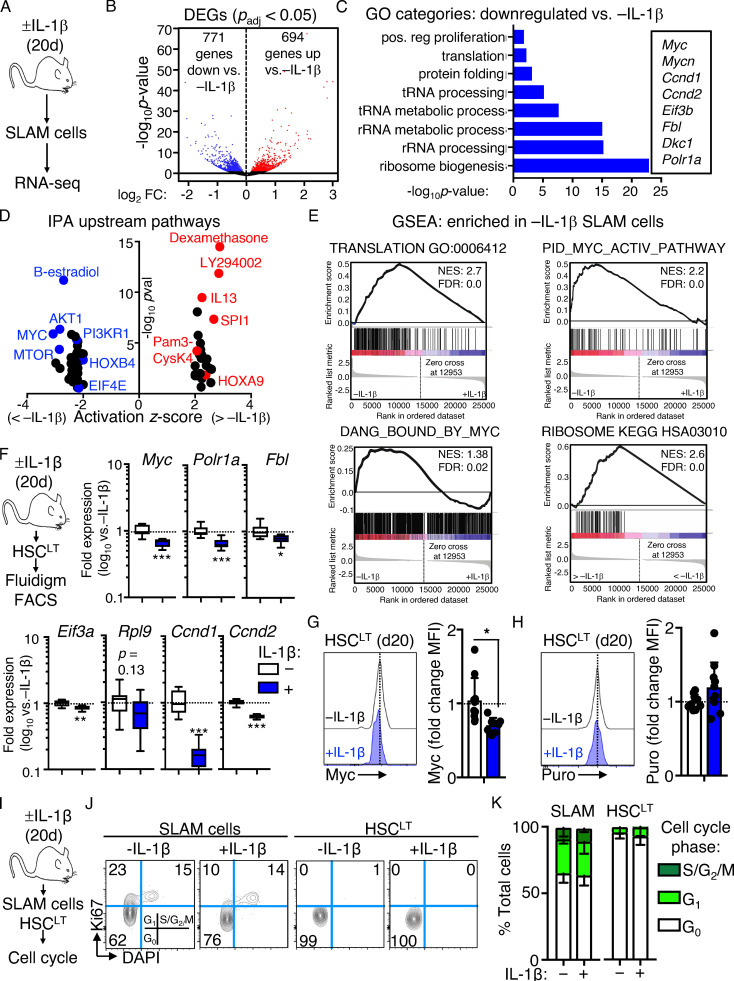
Figure 1.
Chronic IL-1 induces repression of cell cycle and protein synthesis genes. (A) Experimental design for RNA-seq studies (n = 4–7 pools of SLAM cells from mice treated for 20 d ± IL-1β). Pools were generated from three independent cohorts of mice. (B) Volcano plot of DEGs (Padj ≤ 0.05) in IL-1–exposed SLAM cells (LSK/Flk2−/CD48−/CD150+) from A showing log2 fold change (FC) versus −log10 P value significance. See also Table S1. (C) GO category enrichment of downregulated DEGs in IL-1–exposed SLAM cells from A, expressed as −log10 P value. See also Table S2. (D) IPA showing enriched upstream regulators of DEGs in IL-1–exposed SLAM cells from A. See also Table S3. (E) GSEA analysis of significantly downregulated DEGs. GSEA plots show negative enrichment of translation and Myc pathway genes in IL-1–exposed SLAM cells from A. See also Table S4. (F) Experimental design for Fluidigm qRT-PCR analyses and intracellular FACS staining of HSCLT (LSK/Flk2−/CD48−/CD150+/CD34−/EPCR+) from mice treated for 20 d with or without IL-1β (left), and quantification by Fluidigm qRT-PCR array of cell cycle and protein synthesis gene expression in HSCLT (n = 8/group). Data are expressed as log10 fold expression versus −IL-1β. Box represents upper and lower quartiles with line representing median value. Whiskers represent minimum and maximum values. Data are representative of two independent experiments. (G) Intracellular flow cytometry analysis of Myc protein levels in HSCLT (n = 10 −IL-1β; 8 +IL-1β). Data are expressed as fold change of MFI versus −IL-1β. Individual values are shown with bars representing mean values. Data are compiled from three independent experiments. (H) Intracellular flow cytometry analysis of puro incorporation in HSCLT (n = 9 −IL-1β; 10 +IL-1β). Data are expressed as fold change of MFI versus −IL-1β. Individual values are shown with bars representing mean values. Data are compiled from three independent experiments. (I) Experimental design for cell cycle analyses of SLAM cells and HSCLT from mice treated for 20 d with or without IL-1. (J) Representative flow cytometry plots showing cell cycle distribution in SLAM cells and HSCLT from I. (K) Quantification of cell cycle phase distribution in SLAM cells and HSCLT from I (n = 5/group). Data are representative of three independent experiments. *, P < 0.05; **, P < 0.01; ***, P < 0.001 by Mann-Whitney U test or ANOVA with Tukey’s test in K. Error bars represent SD. See also Fig. S1.

