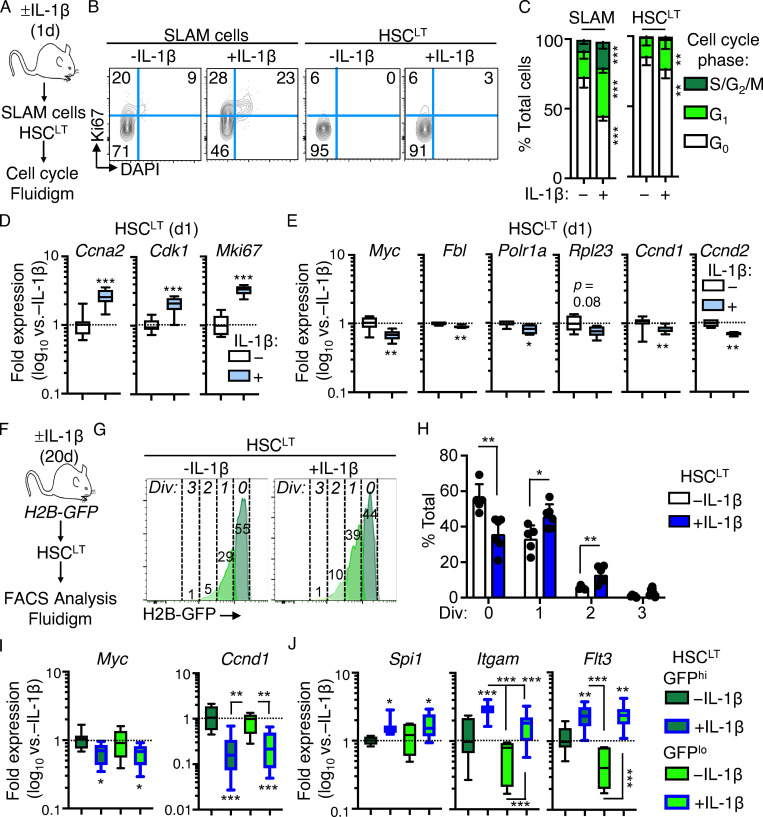
Figure 2.
IL-1–induced gene repression is rapid and independent of HSCLT divisional history. (A) Experimental design for cell cycle analyses of SLAM cells and HSCLT from mice treated for 1 d with or without IL-1β. (B) Representative flow cytometry plots showing cell cycle distribution in SLAM cells and HSCLT from A. (C) Quantification of cell cycle phase distribution in SLAM cells and HSCLT from A (n = 10/group). Data are compiled from three independent experiments. (D) Quantification by Fluidigm qRT-PCR array of cell cycle gene expression in HSCLT from mice treated for 1 d with or without IL-1β (n = 8/group). Data are expressed as log10 fold expression versus −IL-1β. Box represents upper and lower quartiles with line representing median value. Whiskers represent minimum and maximum values. Data are representative of two independent experiments. (E) Quantification of IL-1–repressed protein synthesis and cell cycle genes from Fluidigm qRT-PCR array in D. Data are representative of two independent experiments. (F) Experimental design for analysis of divisional history in HSCLT using H2B-GFP mice treated for 20 d with or without IL-1β. (G) Representative FACS plots showing analysis of HSCLT divisional history via GFP dilution from H2B-GFP mice treated for 20 d with or without IL-1β. (H) Quantification of divisional history of mice in F based on GFP dilution (n = 5–6/group). Data are compiled from two independent experiments. (I) Quantification by Fluidigm qRT-PCR array of IL-1–repressed genes in GFPhi and GFPlo HSCLT from H2B-GFP mice in F (n = 8/group). Data are expressed as log10 fold expression versus −IL-1β. Box represents upper and lower quartiles with line representing median value. Whiskers represent minimum and maximum values. Data are representative of two independent experiments. (J) Quantification of IL-1 target genes from Fluidigm qRT-PCR array in I. Data are representative of two independent experiments. *, P < 0.05; **, P < 0.01; ***, P < 0.001 by Mann-Whitney U test or ANOVA with Tukey’s test in C, H, I, and J. Error bars represent SD. See also Fig. S1.

