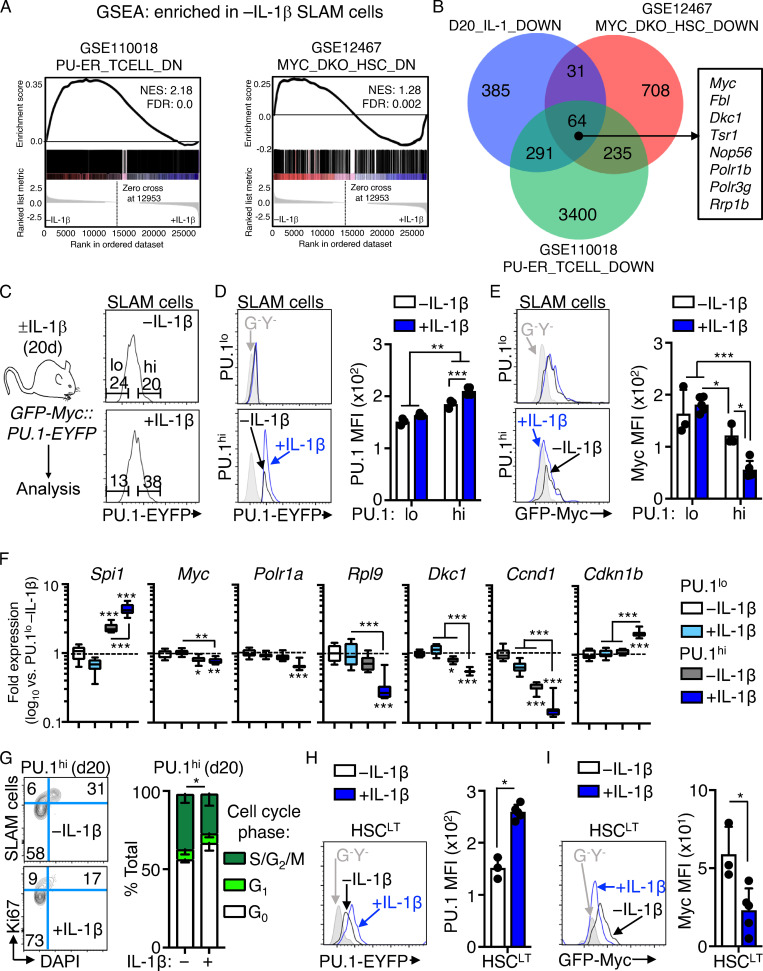
Figure 3.
IL-1–induced gene repression is associated with high PU.1 levels. (A) GSEA enrichment of significantly downregulated genes in publicly available datasets versus RNA-seq analysis of SLAM cells from mice treated with or without IL-1β for 20 d. Data show downregulated genes as negatively enriched in SLAM cells from mice treated for 20 d with or without IL-1β. See also Table S5. (B) Venn diagram showing intersections between gene sets in A. A partial list of common genes is depicted at the right of the diagram. See also Table S6 for complete list of genes. (C) Left: Experimental design for analysis of PU.1-EYFP::GFP-Myc mice treated with or without IL-1β for 20 d. Right: Representative FACS plots showing gating strategy to identify PU.1lo and PU.1hi SLAM cells based on PU.1-EYFP expression levels in these mice. (D) Representative FACS plots (left) and quantification (right) showing PU.1-EYFP expression levels in PU.1lo and PU.1hi SLAM cell fractions from C (n = 3 −IL-1β; 5 +IL-1β). PU.1-EYFP negative control is shown in gray. Individual values are shown with bars representing mean values. Data are representative of two independent experiments. (E) Representative FACS plots (left) and quantification (right) showing GFP-Myc expression levels in PU.1lo and PU.1hi SLAM cell fractions from C (n = 3 −IL-1β; 5 +IL-1β). GFP-Myc negative control is shown in gray. Individual values are shown with bars representing mean values. Data are representative of two independent experiments. (F) Quantification by Fluidigm qRT-PCR array of cell cycle and protein synthesis gene expression in PU.1hi and PU.1lo SLAM cells from mice treated with or without IL-1β for 20 d (n = 8/group). Data are expressed as log10 fold expression versus −IL-1β. Box represents upper and lower quartiles with line representing median value. Whiskers represent minimum and maximum values. Data are representative of two independent experiments. (G) Representative FACS plots (left) and quantification (right) of cell cycle distribution in PU.1hi SLAM cells from mice treated with or without IL-1β for 20 d (n = 3/group) using Ki-67 and DAPI. Data are compiled from two independent experiments. (H) Representative FACS plots (left) and quantification (right) showing PU.1-EYFP expression levels in HSCLT from mice in C (n = 3 −IL-1β; 5 +IL-1β). PU.1-EYFP negative control is shown in gray in FACS plots. Individual values are shown with bars representing mean values. Data are representative of two independent experiments. (I) Representative FACS plots (left) and quantification (right) showing GFP-Myc expression levels in PU.1lo and PU.1hi SLAM cell fractions from mice in C. GFP-Myc negative control is shown in gray in FACS plots. Individual values are shown with bars representing mean values. Data are representative of two independent experiments. *, P < 0.05; **, P < 0.01; ***, P < 0.001 by Mann-Whitney U test or ANOVA with Tukey’s test in D–G. Error bars represent SD. See also Figs. S1 and S2.

