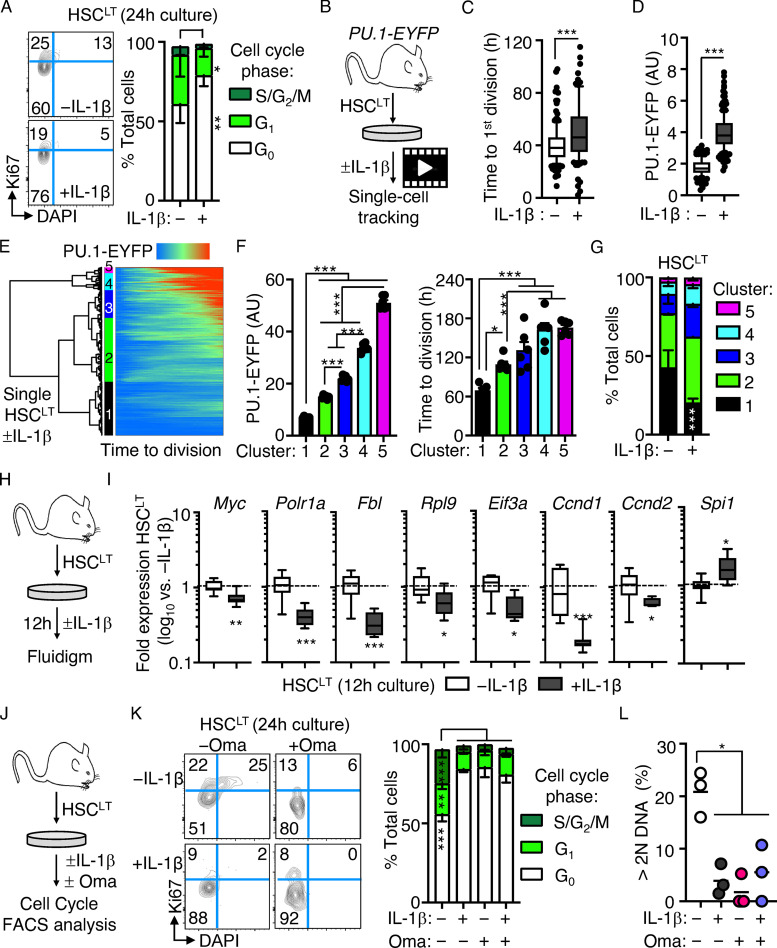
Figure 4.
Direct IL-1 stimulation in vitro induces PU.1 and restricts HSCLT cell cycle entry. (A) Representative FACS plots (left) and quantification (right) of cell cycle distribution in HSCLT cultured for 24 h with or without IL-1β (n = 6/group). Data are compiled from three independent experiments. (B) Experimental design for single-cell tracking studies of PU.1-EYFP HSCLT cultured with or without IL-1β. Time to first cell division was tracked via microscopy. (C) Graph showing kinetics of first cell division in HSCLT from B (n = 194 −IL-1β; 139 IL-1β). Data are compiled from three independent experiments. (D) PU.1-EYFP levels in HSCLT before first cell division (n = 137 −IL-1β; 192 +IL-1β). Data are compiled from three independent experiments. Box shows upper and lower quartiles with line showing median value, and whiskers upper and lower 10th percentile and individual dots represent outliers. (E) Hierarchical clustering analysis of PU.1-EYFP expression over time from the start of observation until the first division in PU.1-EYFP HSCLT cultured with or without IL-1 (Euclidean distance with Ward linkage; n = 557 −IL-1β; 489 +IL-1β). Data are compiled from three independent experiments. (F) Quantification of PU.1-EYFP level (as arbitrary units [AU]; left) and time to division (right) of HSCLT cultured with or without IL-1β in E. Individual values (representing means from cells cultured either with or without IL-1β in an experiment) are shown with bars representing mean values (n = 6). Data are compiled from three independent experiments. (G) Distribution of HSCLT from E in different clusters based on culture with or without IL-1β. Data are compiled from three independent experiments. (H) Experimental design for Fluidigm qRT-PCR array analysis of HSCLT cultured with or without IL-1β for 12 h. (I) Quantification by Fluidigm qRT-PCR array of cell cycle and protein synthesis gene expression in HSCLT from F (n = 8/group). Data are expressed as log10 fold expression versus −IL-1β. Box represents upper and lower quartiles with line representing median value. Whiskers represent minimum and maximum values. Data are representative of two independent experiments. (J) Experimental design for cell cycle analysis of HSCLT cultured with or without IL-1β and with or without 100 nM Oma for 24 h. (K) Representative FACS plots (left) and quantification (right) of cell cycle distribution in HSCLT from H (n = 3/group). Data are from one experiment. (L) Proportion of HSCLT with >2N DAPI signal from H. Individual values are shown with means (horizontal line). *, P < 0.05; **, P < 0.01; ***, P < 0.001 by Mann-Whitney U test or one-way ANOVA with Tukey’s test in F, G, K, and L. Error bars represent SD. See also Fig. S3.

