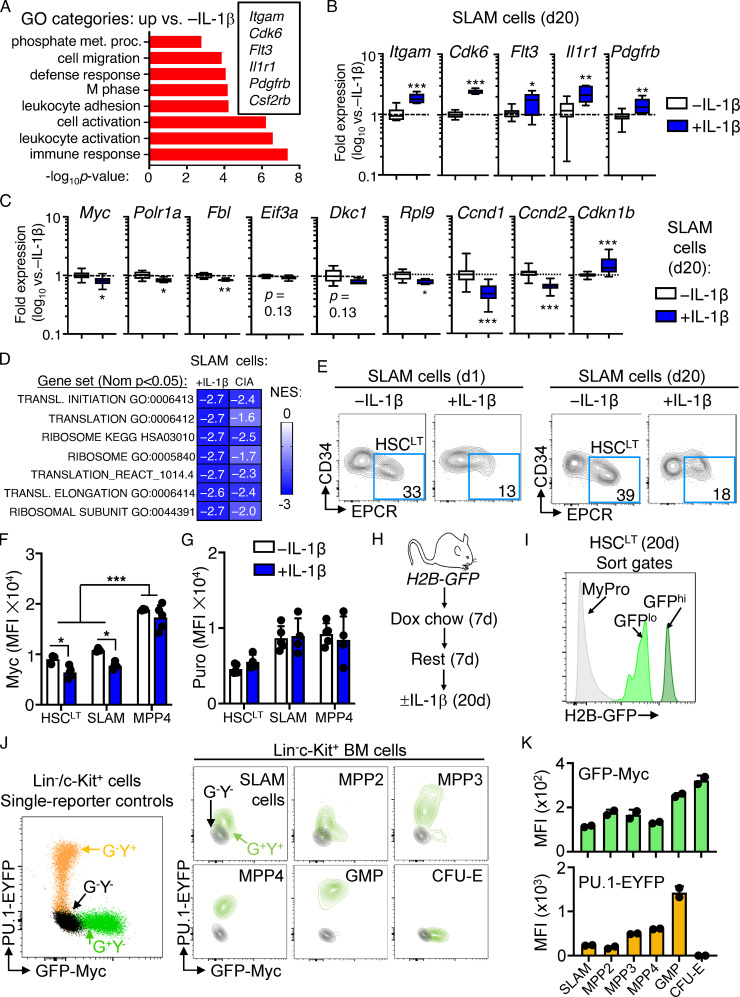
Figure S1.
Characterization of SLAM cells and reporter mice. (A) GO category enrichment of significantly upregulated DEGs in SLAM cells from mice treated for 20 d with or without IL-1β versus 20 d −IL-1β, expressed as −log10 P value. See Table S2 for complete list of GO categories. (B and C) Quantification by Fluidigm qRT-PCR array of gene expression in SLAM cells from mice treated with or without IL-1β for 20 d (n = 8/group). Data are expressed as log10 fold expression versus −IL-1β. Box represents upper and lower quartiles with line representing median value. Whiskers represent minimum and maximum values. Data are representative of two independent experiments. (D) Comparison of normalized enrichment scores (NESs) for indicated gene signatures from IL-1–exposed SLAM cells and SLAM cells from CIA mice (GSE129511). (E) Representative FACS plots showing frequencies of phenotypic HSCLT fraction within the SLAM gate from mice treated with IL-1β versus without IL-1β for either 1 or 20 d. Data are representative of multiple (more than three) experiments. (F) Geometric MFI of Myc from one of three experiments (n = 5/group). Individual values are shown with bars representing mean values. (G) Geometric MFI of puro from one of three experiments (n = 5/group). Individual values are shown with bars representing mean values. (H) Experimental design for H2B-GFP in vivo labeling experiments. Dox, doxycycline. (I) Representative sort gates showing identification of GFPhi and GFPlo populations within the HSCLT gate. Myeloid progenitors (MyPro), which rapidly dilute the GFP label, are shown in gray. (J) Representative FACS plot showing GFP and YFP profiles of single-color control Lin−/c-Kit+ HSPC from Myc-GFP (G+Y−) or PU1-EYFP (G−Y+) mice relative to G−Y− controls (left) and representative FACS plots of defined HSPC populations from Myc-GFP::PU.1-EYFP (G+Y+) mice versus G−Y− controls (right). (K) Quantification of GFP and YFP levels in each HSPC population from mice in J (n = 2/group). Individual values are shown with bars representing mean values. Data in J and K are representative of at least two independent experiments. *, P < 0.05; **, P < 0.01; ***, P < 0.001 by Mann-Whitney U test or ANOVA with Tukey's post-test in F and G. Error bars represent SD.

