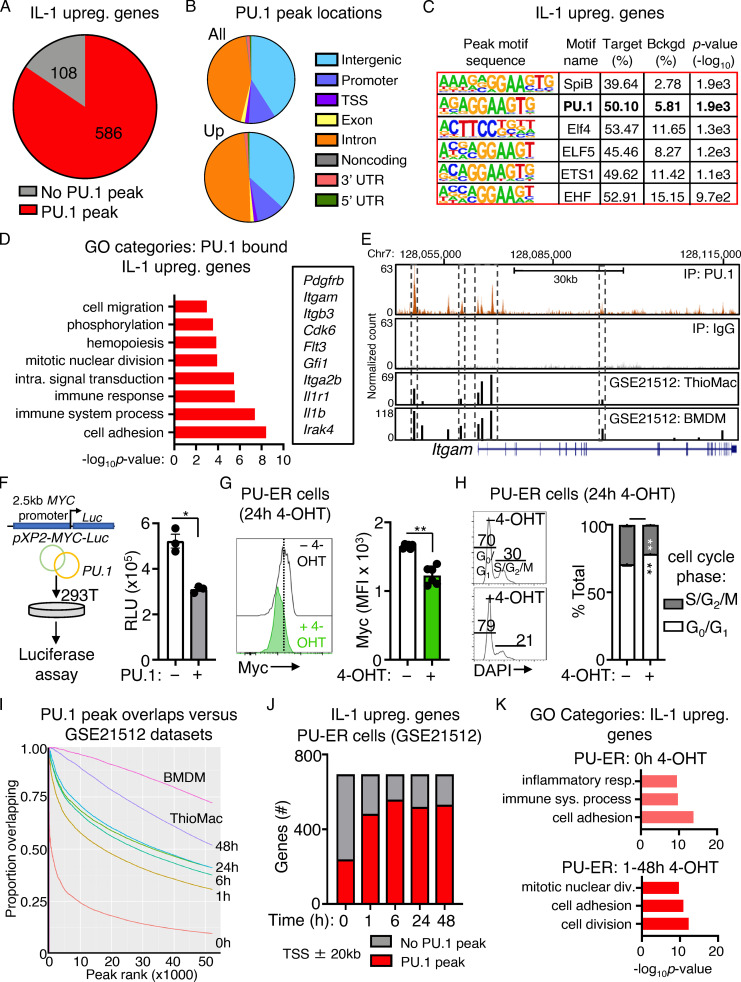
Figure S4.
PU.1 binding to IL-1–upregulated genes and analysis of PU-ER cells. (A) Pie chart comparing IL-1–upregulated genes identified in SLAM cells by RNA-seq analysis in Fig. 1 D and presence of PU.1 peaks at or near these genes (TSS ± 20 kb) in ChIP-seq data. See also Table S4. (B) Pie chart showing proportion of PU.1 peak locations in all genes versus IL-1–upregulated genes. (C) Transcription factor binding site motif enrichment at PU.1 ChIP-seq peak sites located at TSS ± 20 kb in IL-1–downregulated genes. (D) GO category enrichment of IL-1–upregulated DEGs containing PU.1 peaks. Representative genes in the indicated categories are shown to the right. Data are expressed as −log10 P value. See also Table S5. (E) UCSC genome browser rendering of PU.1 peak location in Itgam gene body. Tracks show PU.1 ChIP-seq, WCE control, and peak locations and intensities in thioglycollate-elicited primary mouse macrophage (ThioMac) and BM-derived macrophage (BMDM) PU.1 ChIP-seq datasets from GSE21512. (F) Luciferase reporter assay measuring MYC promoter activity in 293T cells with or without PU.1 (n = 3/group). Data are representative of two independent experiments. (G) Quantification of Myc protein expression in PU-ER cells after 24 h culture with or without 4-OHT (n = 6/group). Data are representative of two independent experiments. Individual values are shown with bars representing mean values. (H) Cell cycle activity in PU-ER cells after 24 h culture with or without 4-OHT (n = 6/group). Data are representative of two independent experiments. (I) Comparison of PU.1 peak overlaps between PU.1 ChIP-seq data in A and datasets from GSE21512. (J) Comparison of IL-1–upregulated genes in SLAM HSCs with genes containing PU.1 peaks within TSS ± 20 kb in PU-ER cells with or without 4-OHT. Based on PU.1 ChIP-seq datasets in GSE21512. (K) GO category enrichment of IL-1–downregulated DEGs containing PU.1 peaks in PU-ER cell ChIP-seq dataset at 0 h with 4-OHT versus combined 1–48 h with 4-OHT. The top three GO categories are shown. Data are expressed as −log10 P value. *, P < 0.05; **, P < 0.01 by Mann-Whitney U test or ANOVA with Tukey’s test in H. Error bars represent SD.

