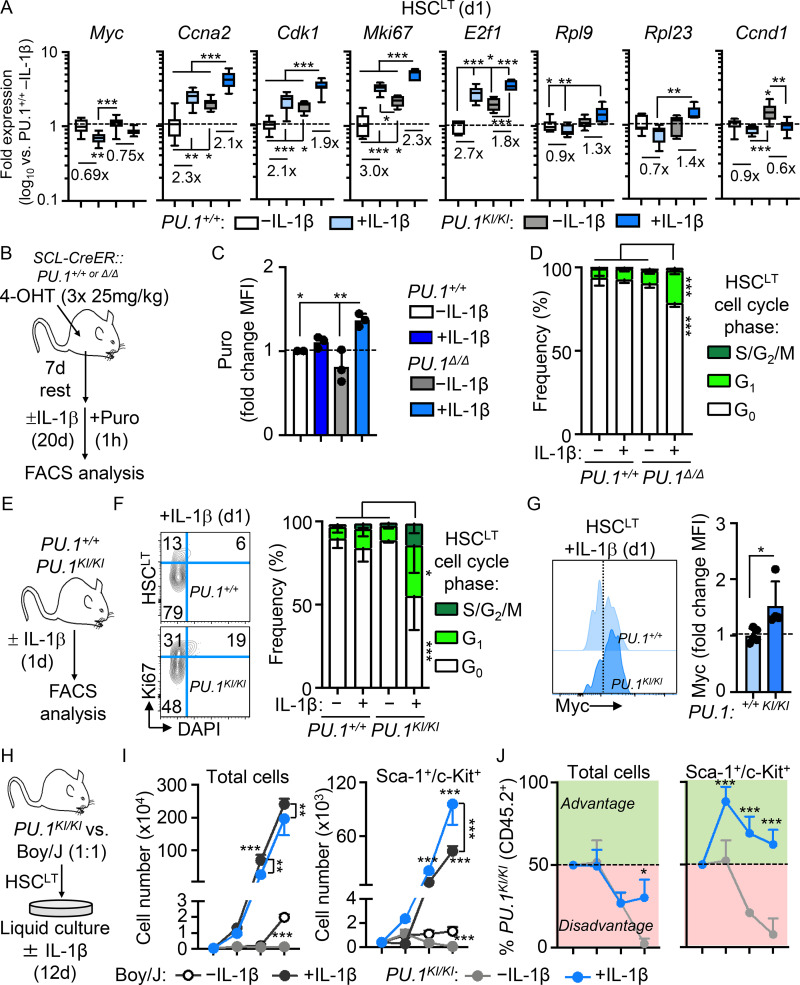
Figure S5.
PU.1 conditional knockout analysis and culture of PU.1KI/KI HSCLT. (A) Quantification by Fluidigm qRT-PCR array of cell cycle and protein synthesis gene expression in HSCLT from mice treated with or without IL-1β for 1 d (n = 8/group). Data are expressed as log10 fold expression versus −IL-1β. Box represents upper and lower quartiles with line representing median value. Whiskers represent minimum and maximum values. Data are from one experiment. (B) Study design for Cre induction with 4-OHT and analysis of HSCLT from SCL-CreERT PU.1+/+ and PU.1Δ/Δ mice treated with or without IL-1β for 20 d (n = 2–3/group). (C) Intracellular flow cytometry analysis of puro incorporation in HSCLT from mice in E. Puro was injected i.p. 1 h before BM harvest. Data are expressed as fold change of MFI versus −IL-1β. Individual values are shown with bars representing mean values. Data are representative of two independent experiments. (D) Quantification of cell cycle phase distribution in HSCLT from PU.1+/+ and PU.1Δ/Δ mice in B based on Ki-67 and DAPI. Data are representative of two independent experiments. (E) Experimental design for analysis of HSCLT from PU.1+/+ and PU.1KI/KI mice treated with or without IL-1β for 1 d. (F) Representative FACS plots (left) and quantification (right) of cell cycle phase distribution in HSCLT from mice in H based on Ki-67 and DAPI (n = 7–8/group). Data are compiled from two experiments. (G) Myc levels from PU.1+/+ and PU.1KI/KI mice treated with IL-1β for 1 d (n = 4–5/group). Individual values are shown with bars representing mean values. Data are compiled from two experiments. (H) Experimental design for competitive in vitro assays on Boy/J and PU.1KI/KI HSCLT cultured in a 1:1 ratio with or without IL-1β for 12 d. (I) Quantification of total cells (left) and immature Sca-1+/cKit+ progenitors at the indicated time points (n = 3/group). (J) Quantification of frequency of total (left) and immature (right) CD45.2+ cells derived from PU.1KI/KI HSCLT cultured with or without IL-1β at the indicated time points. Percentages >50 (color coded green in the graphs) are indicative of a competitive advantage for PU.1KI/KI cells. Data are representative of two independent experiments. *, P < 0.05; **, P < 0.01; ***, P < 0.001 by Mann-Whitney U test in G or ANOVA with Tukey’s test. Error bars represent SD.

