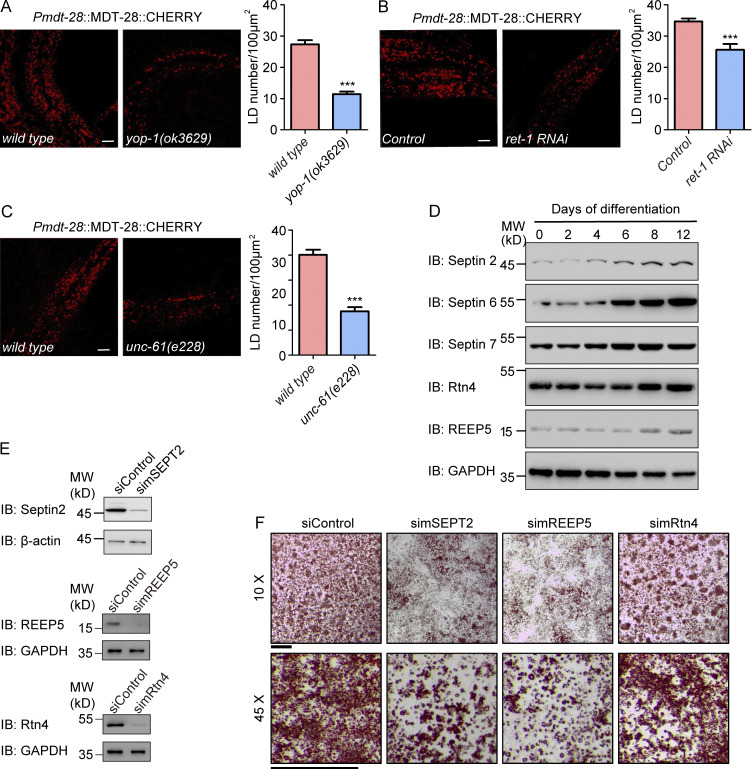
Figure 6.
Functional tests of FIT2-interacting proteins. (A) Representative confocal images of wild-type and yop-1(ok3629) larval stage L4 animals carrying the ldrIs2 (Pmdt28::mdt28::cherry) transgene. Images are 3D projections of 2.62-µm confocal z-stacks that covered the posterior body forward from the vent. LD quantification is shown on the right. n = 16 (wild-type) and 18 (yop-1) animals. Unpaired t test, ***, P < 0.001. Scale bar, 10 µm. (B) As in A, but with RET-1–depleted animals generated by RNAi feeding. n = 7 (wild-type) and 11 (ret-1) animals. Unpaired t test, ***, P < 0.001. Scale bar, 10 µm. (C) As in A, but with unc-61(e228) mutant. n = 10 (wild-type) and 13 (unc-61) animals. Unpaired t test, ***, P < 0.001. Scale bar, 10 µm. Error bars represent SEM. (D) Differentiated 3T3-L1 cells were collected at the indicated times, and protein levels were detected by immunoblotting (IB) with the indicated antibodies. (E) The knockdown efficiency of the indicated siRNAs in 3T3-L1 cells was measured by IB. (F) Representative images of 3T3-L1 adipocytes. On day 10, differentiated 3T3-L1 cells were fixed and stained with Oil Red. Images were captured using a stereomicroscope under the indicated magnifications. Scale bar, 2 mm. siControl, small interfering Control; simSEPT2: small interfering mouse SEPT2; simREEP5: small interfering mouse REEP5; simRtn4, small interfering mouse Rtn4.

