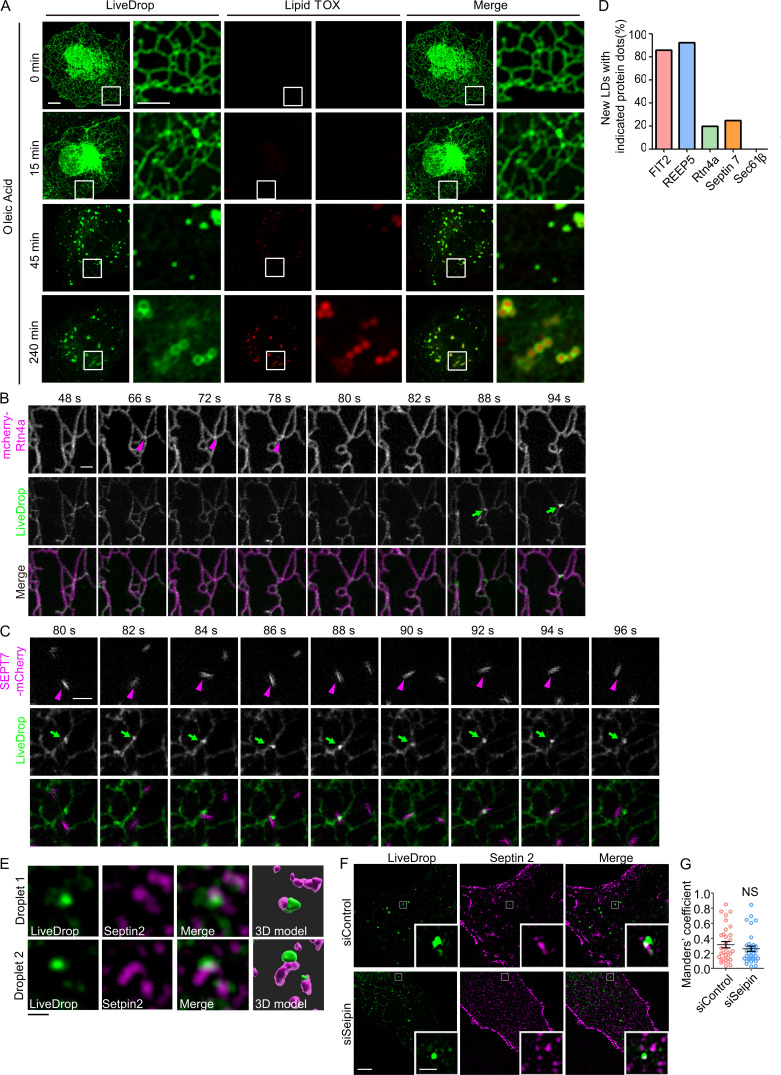
Figure S5.
Tubule-forming proteins and septins participate in the early steps of LD biogenesis. (A) As in Fig. 7 A, COS-7 cells transfected with GFP-LiveDrop (green) were fixed at the indicated time points and stained with LipidTOX (red). The boxed regions are magnified on the right. Scale bar, 10 µm; 5 µm (inset). (B) Rtn4a appeared at LD biogenesis sites before LiveDrop accumulation. As in Fig. 8 A, but with cells expressing mcherry-Rtn4a and LiveDrop. Magenta arrowheads indicate the accumulation of Rtn4a, and green arrows indicate the nascent LDs. Scale bar, 1 µm. (C) Living cell images show the colocalization between septin 7 and nascent LDs. As in Fig. 8 A, but with cells expressing SEPT7-mCherry and LiveDrop. Magenta arrowheads indicate the accumulation of septin 7, and green arrows indicate the nascent LDs. Scale bar, 1 µm. (D) Percentage of nascent LDs with the indicated protein dots that appeared before LiveDrop accumulation in Fig. 8, A and B and Fig. S5, B and C. n = 10–14 nascent LDs in three cells for each group. (E) Representative images of the colocalization of nascent LDs (LiveDrop) and endogenous septin 2 in Fig. 8 C. 3D models were computed by Imaris software. Scale bar, 1 µm. (F and G) As in Fig. 8, E and D, but COS-7 cells were transfected with siControl or siSeipin. The Mander’s coefficient was measured by ImageJ. In each group, 30–40 ROIs in 8–12 cells were measured. Unpaired t test, NS, P > 0.05. Scale bar, 5 µm; 1 µm (inset). ROI, region of interest; siControl, small interfering Control; siSeipin, small interfering seipin. Error bars represent SEM.

