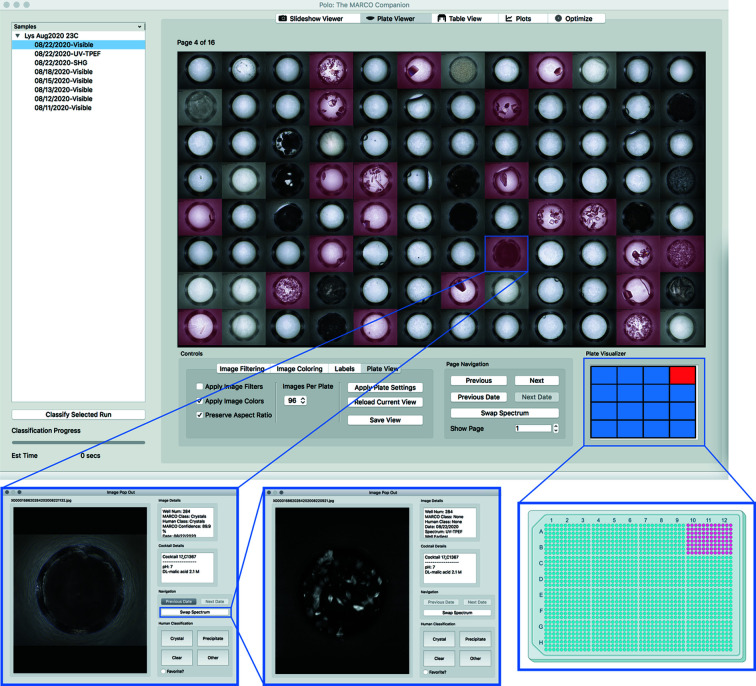
Figure 2.
Screenshot of the Plate Viewer interface. (Top) 96 of the 1536 wells in the microassay plate with MARCO classified wells for this subset colored in red. (Bottom) Left: Image Pop Out for one of the wells with crystals in this subset (hidden by precipitate but correctly classified by MARCO). Middle: the Swap Spectrum button changes the image to UV-TPEF, in which the crystals are more clearly apparent. Right: schematic of how the Plate Visualizer indicates where on the 1536 microassay plate the images are from. The 96 images shown are from the upper right 1/16th of the 32 × 48 grid microassay plate.

