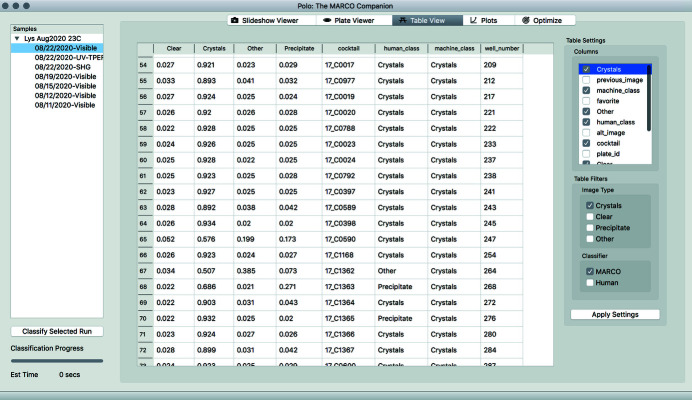
Figure 3.
Screenshot of Table View displaying data for all MARCO classified images of a lysozyme sample imaged on 8/22/2020. Similar to the Slideshow Viewer interface, data displayed can be filtered by either MARCO or human classification using the checkboxes located in the lower right under the Table Filters box. Additionally, the type of data that are displayed in the columns can be controlled by using the checkboxes in the upper right of the interface under the Table Settings box.

