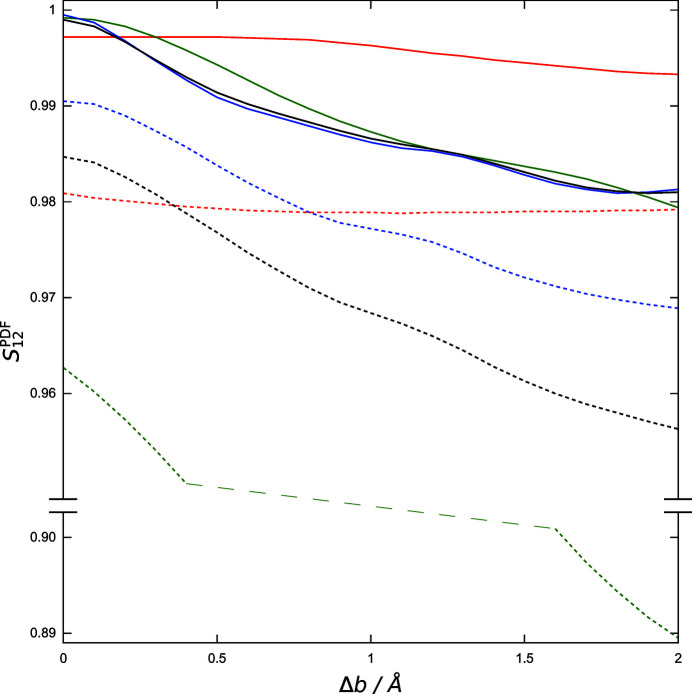
Figure 13.
The impact of the change of the lattice parameter b (models R, B1–B20) on the  values computed for the full range of the PDF (1.1–30 Å, black line, see also Fig. 7 ▸) and for the ranges of intramolecular distances (1.1–3.3 Å, red), intermolecular distances (6–30 Å, blue) and the overlap region (3.3–6 Å, green). Solid lines represent structural models of barbituric acid and dashed lines the corresponding models where barbituric acid was replaced by benzene.

