Figure 3.
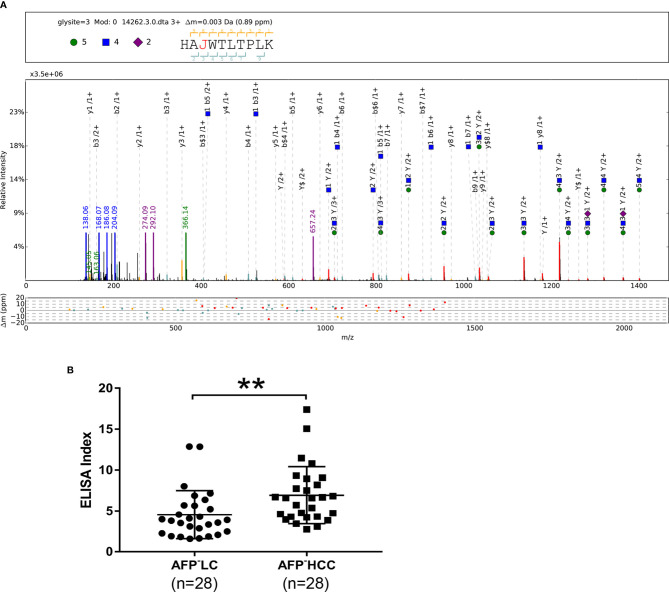
(A) pGlyco annotations of HAN253WTLTPLK (H5N4S2) of PON1. “J” represents the glycosylation site “N”; green circle: H, hexose; blue square: N, N-acetylglucosamine; purple rhombus: S, sialic acid. The upper frame of each spectrum is designed to annotate peptide sequence and glycan composition. The mass deviations of the annotated peaks are shown in the box below. (B) Scatter plot of ELISA Indices (LC, n = 28; HCC, n = 28). **p < 0.01.

