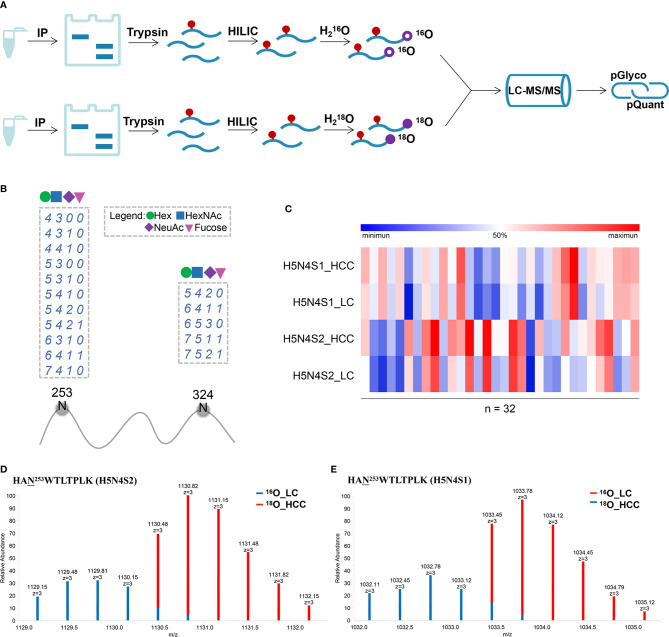
Figure 4.
(A) Workflow for labeling quantification of N-glycopeptides. (B) Visualization of all identified glycosylation sites (N) on PON1. The glycan compositions are expressed by the numbers of Hex, HexNAc, NeuAc, and Fucose (dashed box). (C) Heat map of the two differentially expressed intact glycopeptides in PON1 (site N253) between AFP-negative HCC and cirrhosis (LC, n = 32; HCC, n = 32). (D) MS1 spectrum of HAN253WTLTPLK (H5N4S2). pQuant reported that the 18O/16O ratio was 2.82. (E) MS1 spectrum of HAN253WTLTPLK (H5N4S1). pQuant reported that the 18O/16O ratio was 2.61.

