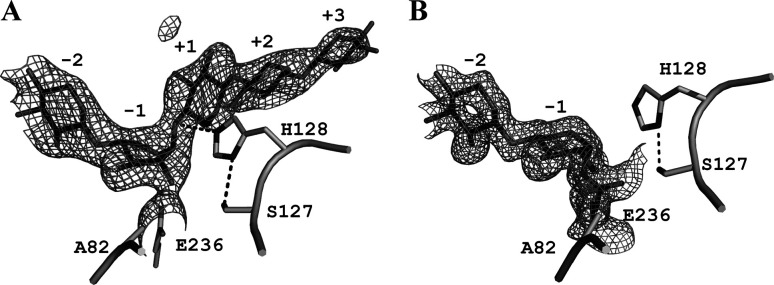
Fig. 3. Crystal structures of E·S and E–I complexes of T82A-SEA.
Close-up views around the active site of T82A-SEA/X5 (5GQE) (A) and T82A-SEA/pNP-X2 (5GQD) (B) are shown with the Fobs–Fcalc omit electron density maps contoured at 3.0σ The key residues and hydrogen bonds are shown as stick models and dashed lines, respectively. The sugar units occupying subsite –1 in the E·S and the E–I complexes adopted the 1S3 and 4C1 conformations, respectively.

