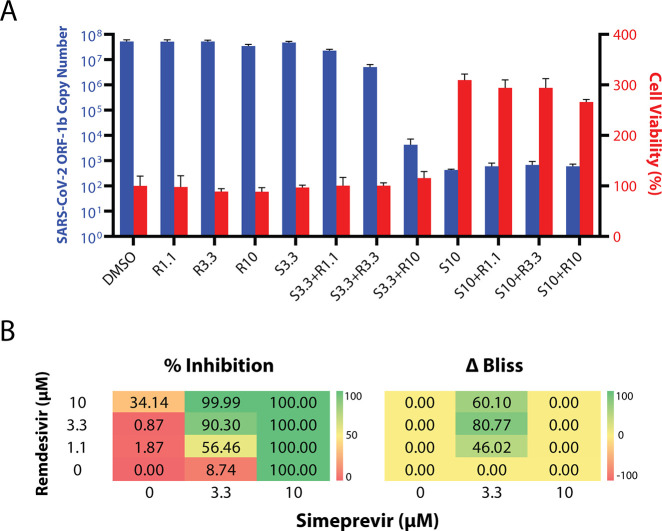
Figure 2.
(A) Viral replication–suppression efficacies of different combinations of simeprevir and remdesivir concentrations. The numbers after S (simeprevir) and R (remdesivir) indicate the respective drug concentrations in μM. Data points in all plots represent mean ± S.E.M. For all data points, n = 3 replicates. (B) Bliss score analyses of synergism. (left) Diagram showing 12 combinations of simeprevir and remdesivir and their respective percentage inhibition (% inhibition, color-coded) of SARS-CoV-2 replication in Vero E6 cells compared to DMSO controls. (right) Excess over Bliss score (ΔBliss, color-coded) of different drug combinations. A positive and negative number indicates a likely synergistic and antagonistic effect, respectively, while a zero value indicates independence of action.

