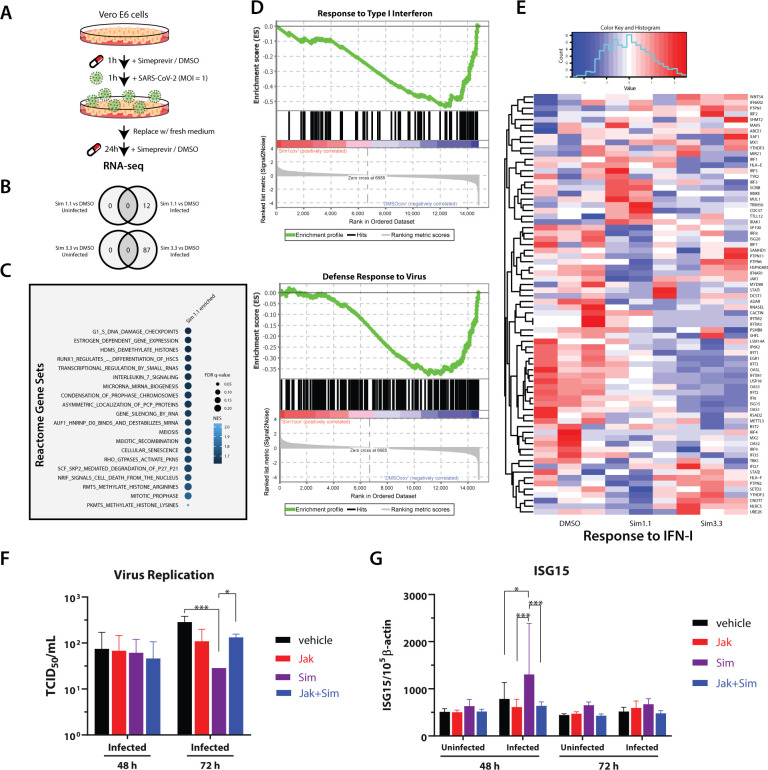
Figure 4.
RNA-seq analysis and validation of simeprevir-mediated host response and antiviral activity. (A) Schematic representation of RNA-seq sample preparation. Treatment sequence and incubation time of simeprevir and SARS-CoV-2 was indicated with arrows and legends. (B) Venn diagrams showing differentially expressed genes (DEGs) comparing simeprevir-treated (1.1 or 3.3 μM), infected, and mock-infected samples. (C) Bubble plot of top 20 hits of positively enriched reactome gene sets under simeprevir treatment using gene set analysis (GSEA). Enriched gene sets were filtered with criteria false discovery rate (FDR) q-value < 0.25 and nominal p-value < 0.05 before ranked with their normalized enrichment scores (NES). (D) Enrichment plots of GSEA results using gene ontology (GO) gene sets. (E) Clustered heatmap showing the row-normalized expression level of genes belonging to GO term “response to type I interferon”. (F) Viral titration assay using A549-ACE2 cells treated with 4 μM simeprevir and/or 1 μM JAK inhibitor I. (G) Relative RNA level of ISG15 in uninfected or infected A549-ACE2 cells, treated with 4 μM simeprevir and/or 1 μM JAK inhibitor I. Data points in all plots represent mean ± S.D. For all data points, n = 3 replicates; * p-value < 0.05, *** p-value < 0.005.

