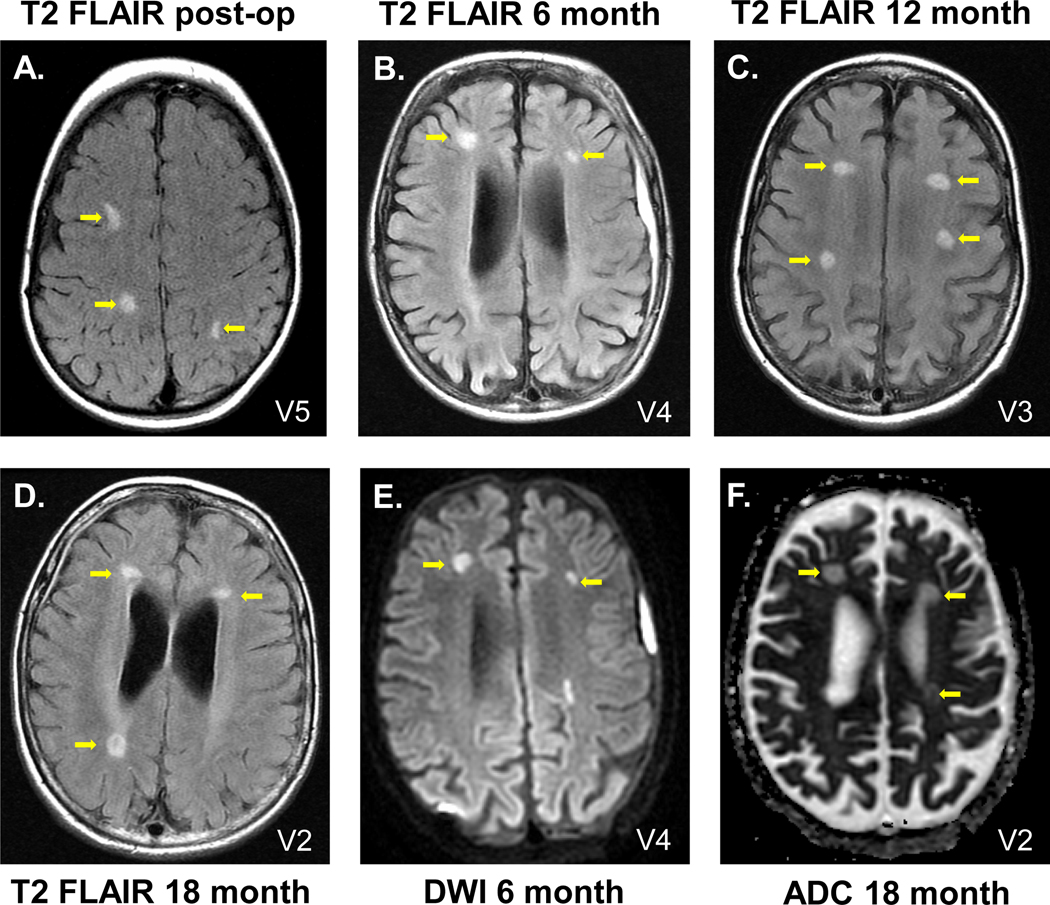
Figure 1. Axial T2 FLAIR (T2 FLAIR), diffusion weighted imaging (DWI) and apparent diffusion coefficient (ADC) MRI assessment of participants post-therapy.
MRI abnormalities were localized at the sites of the catheter tips, where there is the highest concentration of the administered vector. A-D. Examples of T2 FLAIR. A. Participant V5, 1 day post-administration; B. V4, 6 months; C. V3, 12 months; D. V2, 18 months. E. Example of DWI, participant V4, 6 months. F. Example of ADC, participant V2, 18 months. Yellow arrows identify the abnormalities. See Table 4 for the complete dataset of T2 FLAIR, DWI and ADC abnormalities observed.

