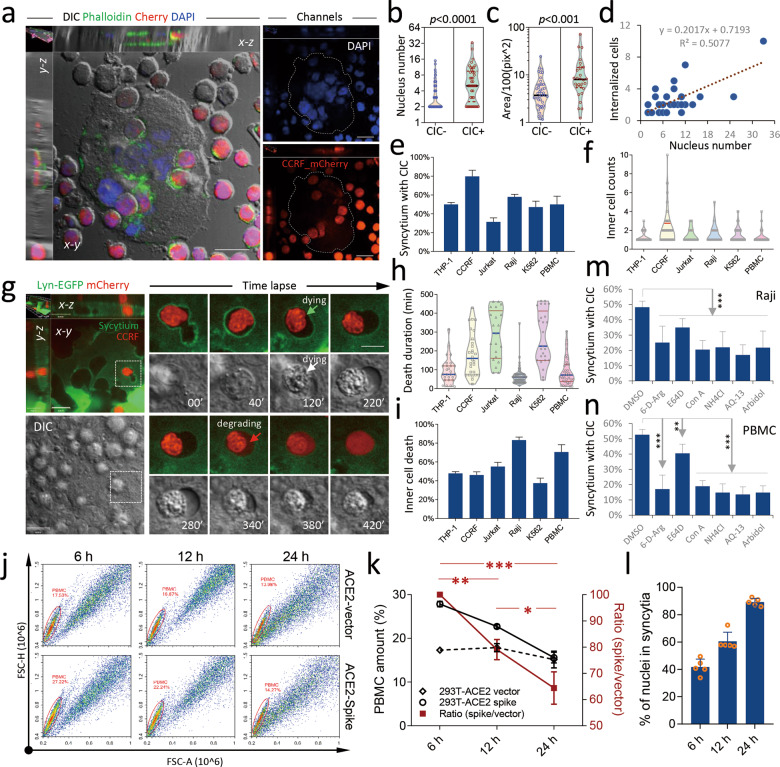
Fig. 3. Syncytia internalize lymphocytes for cell-in-cell mediated death.
a Representative images of a syncytium internalizing CCRF-mCherry cells to form cell-in-cell structures. Cells were stained with Phalloidin (green) and DAPI (blue). Scale bar: 20 μm. Graph plots of nuclei number (b) and area (c) of syncytia that internalizing CCRF-mCherry cells (CIC+, n = 41) or not (CIC−, n = 75). d Positive correlation between the nucleus number of syncytia and internalized CCRF-mCherry number. Analysis was performed by Spearman rank correlation. n = 41. Quantification of the formation frequency (e) and internalized cells (f) in cell-in-cell structures formed between syncytia and indicated cells. Data represent the mean ± SD of 10 or more fields with more than 100 syncytia analyzed each for e. n (left to right) = 44, 51, 28, 36, 43 and 45, respectively, for f. g Representative images and image sequence for the death of an internalized CCRF-mCherry cell within a syncytium. Green arrow indicates the dying of the internalized CCRF-mCherry cell; red arrow indicates the degradation of the internalized CCRF-mCherry cell. Scale bars: 20 μm for the left images; 10 μm for the right images. Plots of the duration (h) and frequency (i) of the death of the indicated cells in syncytia. n (left to right) = 24, 28, 21, 55, 24 and 38, respectively, for h. Data are the mean ± SD from 10 or more fields with more than 50 cell-in-cell structures analyzed each for i. j Representative FCM graphs for the respective cocultures of PBMC with 293T-ACE2-vector and 293T-ACE2-spike cells for different periods as indicated. k The quantification of PBMC changes over the indicated times in co-culture experiments. j The right Y axis is for the PBMC ratio between the two co-culture experiments (293T-ACE2-vector and 293T-ACE2-spike, respectively). Data are the mean ± SD of results from triplicate experiments. **p < 0.05, **p < 0.001, ***p < 0.0001. PBMC were added into the 293T-ACE2 cells 12 h post transfection with the empry vector or spike construct, respectively. l Quantification of syncytia formation in 293T-ACE2-spike cells at the indicated time points post PBMC adding. Data are the mean ± SD of results from 5 fields (20x objective lens) each. Note: syncytia were not formed in 293T-ACE2-vector cells. The inhibitory effects of the indicated compounds on the formation of cell-in-cell structures formed between syncytia and Raji cells (m), or PBMC (n). Data are the mean ± SD from 10 or more fields with more than 100 syncytia analyzed for each field. **p < 0.001, ***p < 0.0001.

