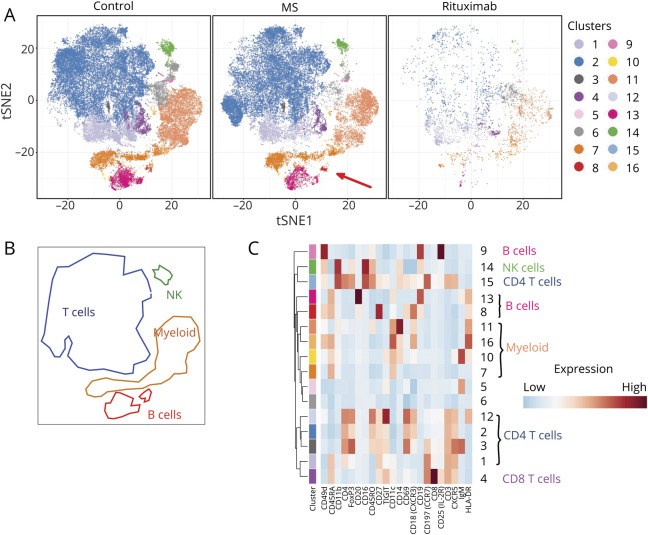
Figure 1. Cell Types in CSF of Patients With MS or Other Diagnoses.
(A) tSNE plot of cells from CSF. Data were clustered using k-means, and the clusters colored as shown in the key on the right of the figure, in a fashion exactly analogous to figure e-1, links.lww.com/NXI/A386. The characteristics of these clusters are shown in heatmap (C). The tSNE plot on the left shows data from cells from CSF of patients with non-MS diagnoses, the figure in the middle shows data from patients with MS, and the figure on the right shows data from patients with MS treated with rituximab. The red arrow in the bottom right corner of the middle tSNE plot indicates a cluster that is more abundant in CSF from patients with MS than in controls (see below). For this analysis, cells from CSF were clustered and analyzed independently, unlike in figure 1, enabling the detection of clusters that are specific to CSF, and too small to see against the background of the much larger dataset from blood. (B) Areas of the tSNE plots in (A) have been matched to the broad cell types myeloid, NK cells, T cells, and B cells. (C) Heatmap showing, for each of the clusters generated by k-means, the average intensity of each marker across all cells in the cluster. The colored bars at the top of the heatmap match the colors used in the tSNE plots in (A), and clusters corresponding to well-established cell types are shown on the right. Higher average expression of each marker is indicated with a red-brown color, and lower expression in blue.

