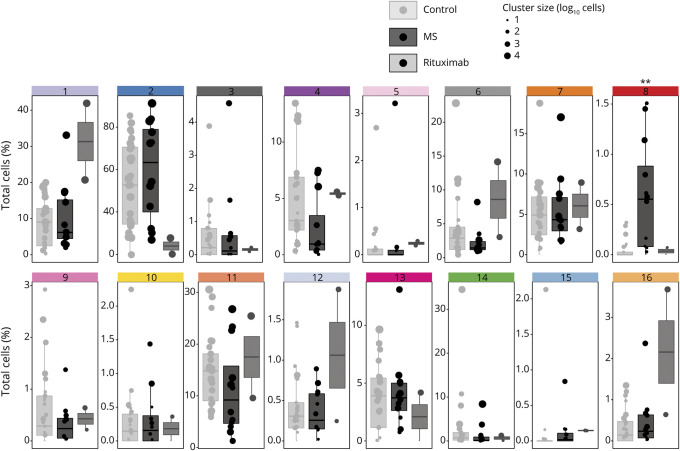
Figure 2. Relative Abundances of Cell Types in CSF of Patients With MS or Other Diagnoses.
For each donor, the relative abundance of the cluster (% of total cells) was plotted for each cluster described in figure 1. Cluster identity numbers are at the top of each boxplot, and the colors of the bars at the top of each boxplot match the colors used to mark the clusters in figure 1. Within each scatter column, each filled circle represents 1 donor. The diameter of the circles reflects the absolute size of the cluster in that donor. The 35 donors are separated into 3 groups: donors with other diagnoses than MS (control, light gray boxes on the left of each boxplot); donors diagnosed with MS, but not treated with CD20-depleting antibodies (dark gray box in middle); and donors diagnosed with MS and treated with rituximab (gray box on right). Data from 2 rituximab-treated patients are shown for interest without statistical inference. The asterisks mark the cluster in which there was a statistically significant difference in abundance between control and MS (generalized linear mixed model; **p = 0.0012, FDR = 0.0192). FDR = false discovery rate.

