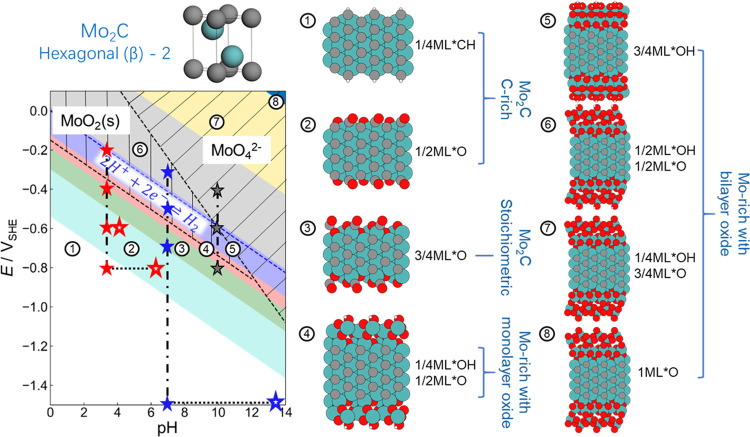
Figure 2.
Ab initio thermodynamics surface Pourbaix (E/pH) diagram for Mo2C(110) and possible MoO2(100) surface oxide formation. The data here are for the more stable hexagonal (β)-2 bulk phase, while analogue results for the (β)-1 phase are given in Figure S6. The generic stability ranges of bulk MoO2 and dissolved MoO42–, as calculated for the parent metal,27 are indicated by black hatched areas. Side views of the stable surface phases ①–⑧ are shown on the right (Mo, C, O, and H atoms are depicted as green, gray, red, and white spheres, respectively). The surface terminations in terms of fractions of monolayers (ML) defined with respect to MoO2(100)-(1 × 1) are also provided. The blue dashed line indicates the thermodynamic onset potential of the hydrogen evolution reaction. Experimentally tested conditions are marked by stars, solid stars for nominal pH conditions, and hollow stars after considering surface pH changes (see text and Figure 4).

