
Figure 4.
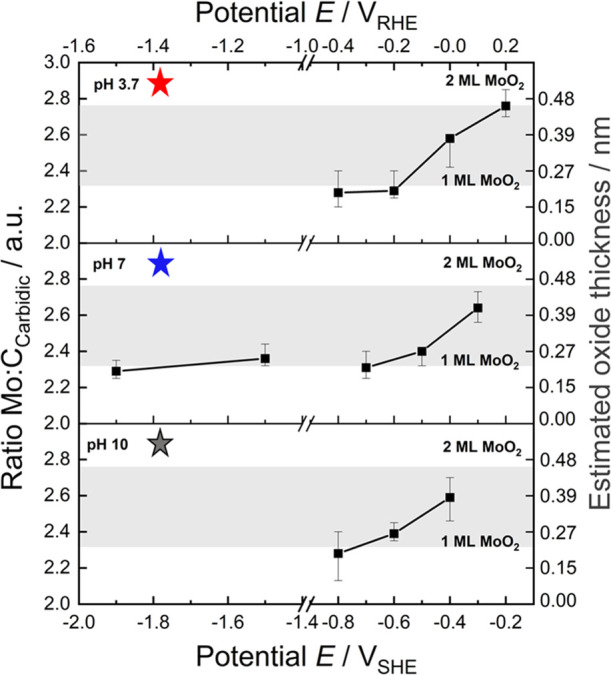
Experimental Pourbaix diagram confirming surface oxide formation under all relevant CO2RR conditions. The correlation between the Mo/Ccarbidic ratio and the estimated oxide layer thickness is given in Figure S19. For the calculation of the error bars, we refer to Supporting Information Note 4. The shaded regions indicate the thickness expected for one or two monolayers (ML) MoO2(100). The probed reaction conditions are indicated by correspondingly colored stars in the theoretical surface Pourbaix diagram in Figure 2.