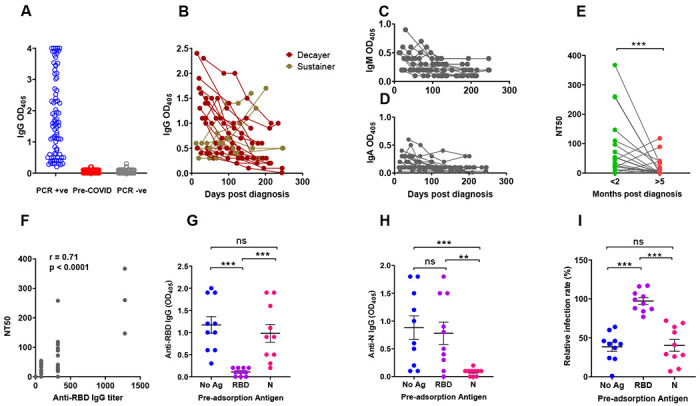
Fig. 1. SARS-CoV-2 Spike S1 Receptor Binding Domain antibody levels and plasma neutralization activity.

(A-D) Receptor Binding Domain (RBD)-specific antibody binding was determined by ELISA using serum/plasma samples diluted 1:80. (A) Dot plot showing anti-RBD IgG antibody levels in subjects PCR-positive for SARS-CoV-2 infection (n = 83, blue circles); pre-COVID-19 samples (n = 104; red circles); subjects SARS-CoV-2 PCR-negative for at least 16 weeks following the blood draw used in this figure (n = 103 subjects; grey circles). Each circle corresponds to one subject. (B) The line graph shows the trajectory of IgG antibody levels for 22 subjects over the indicated time post-PCR result. Symbol colors distinguish decayers (n=16) showing downward trajectories (dark red symbols) and sustainers (n=6) showing stable or upward trajectories (dark yellow symbols). (C,D) Line graphs showing IgM and IgA antibody levels, as indicated, in the same subjects as (B). (E-G) Neutralizing activity of plasma was determined utilizing ACE2-expressing HeLa cells and mNeonGreen-tagged SARS-CoV-2 virus. (E) Neutralizing titers were expressed as NT50 (reciprocal dilution of plasma yielding 50% neutralization), as obtained with samples collected <2 months (green circles) or >5 months (red circles) post-diagnosis from the same 22 subjects. Each pair of circles connected by a line represents one subject. (F) Correlation analysis between anti-RBD IgG endpoint titers (x-axis) and neutralizing titers (y-axis) (n = 44). The Spearman’s correlation coefficient r and corresponding p value were calculated. (G-H) Selected plasma samples (n = 10) exhibiting NT50 >80 were depleted of either RBD- or N-specific antibodies by pre-incubating them with either recombinant RBD or N (Nucleocapsid) proteins and then tested for ELISA reactivity. No Ag, mock pre-adsorption; RBD, pre-absorption with RBD; N, pre-absorption with N. The panels show IgG antibody binding by ELISA using RBD (panel G) or N (panel H) as solid-phase antigen and pre-adsorbed plasma (No Ag, RBD, N). (I) Neutralization activity of pre-absorbed plasma samples (No Ag, RBD, N, as in panels G-H). Relative infection rates, shown in the Y axis of the scatter plot, were obtained by dividing the fluorescence readings (derived from fluorescently tagged virus) of the sample-treated wells by the untreated control wells (infection rates above 100% result from small biological variations among untreated wells, and indicate no neutralization). In all panels, the solid black lines represent the median and Interquartile range. Statistical analyses in (G-I) were conducted by Wilcoxon matched pairs signed rank test (**, p ≤ 0.01; ***, p ≤ 0.001; ns, non-significant, p > 0.05).
