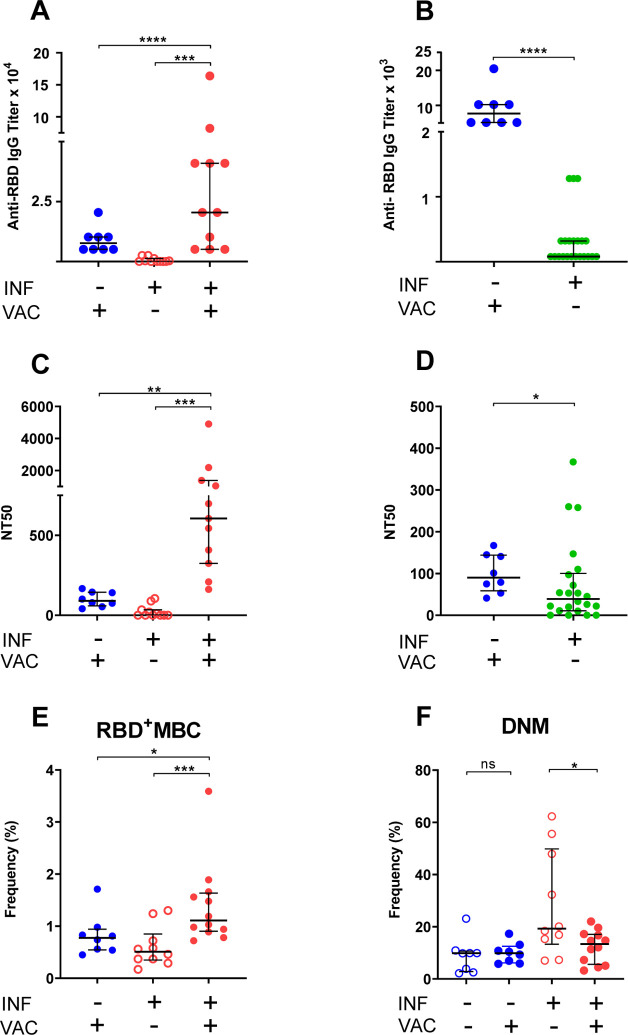
Fig. 2. Humoral and B cell responses to COVID-19 mRNA vaccination.
Responses to COVID-19 RNA vaccines in previously infected study subjects and infection-naïve comparators were measured. Receptor Binding Domain (RBD)-specific IgG antibody binding, plasma neutralizing activity, and B cell frequencies were assessed as in Fig. 1. Infection (INF) and vaccination (VAC) status are indicated by the corresponding (+) and (−) signs. (A,B) Titers of RBD-specific IgG by ELISA. (C,D) NT50 determinations. Pre-vaccination samples of SARS-CoV-2-infected subjects were either those collected at the last visit before vaccination to determine effect of vaccination (panels A,C) or those collected at the first visit post-diagnosis to compare responses to recent infection and recent vaccination (panels B,D). (E) Frequency of RBD-specific memory B cells (RBD+ MBC). (F) Frequency of total double-negative memory B cells (DNM, CD27− IgD−). The entire B cell dataset is found in supplementary Table 4. In all panels, data are shown as scatter plots; each circle represents one study subject; the solid black lines represent the median and interquartile range. Statistical analysis was performed either with Mann-Whitney U-test for unpaired data or Wilcoxon matched-pairs signed rank test for paired samples (*, p ≤ 0.05; **, p ≤ 0.01).

