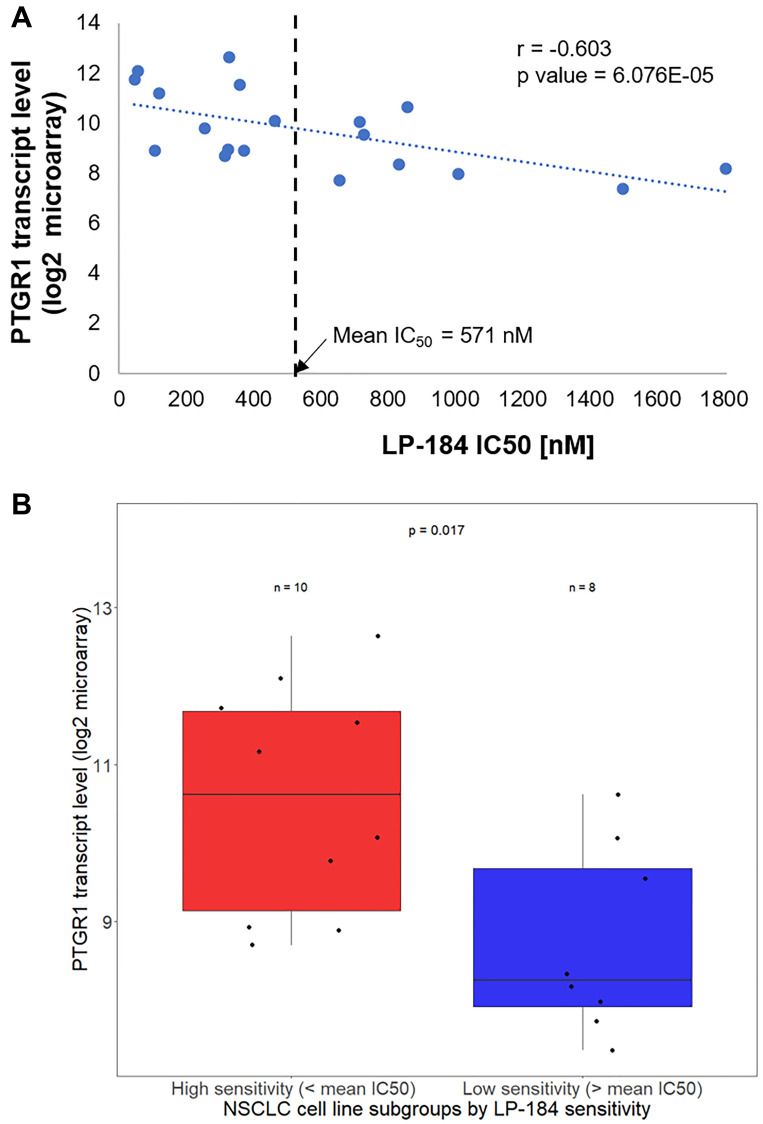
Figure 2. LP-184 sensitivity in NSCLC cell lines correlates with PTGR1 transcript levels.
(A) This scatter plot shows the correlative trend between LP-184 sensitivity on X axis and PTGR1 transcript levels across the 19 NSCLC cell lines tested. (B) This box plot statistically compares PTGR1 transcript levels between LP-184 high and low sensitive cell lines.

