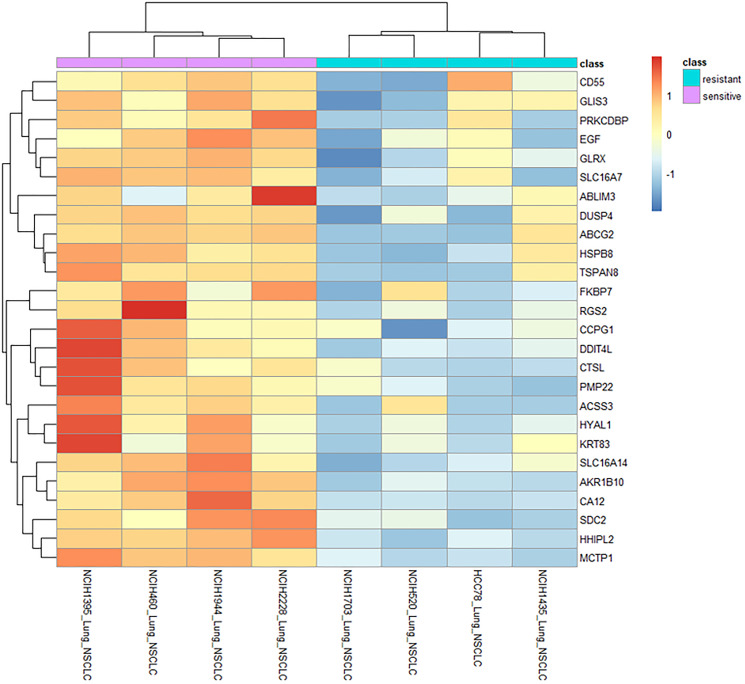
Figure 4. Gene correlation and expression pattern analyses across differentially sensitive NSCLC cell lines highlights key processes potentially linked with LP-184 activity.
Heatmap shows expression patterns of genes (vertical axis) correlated significantly with LP-184 sensitivity (p value < 0.01) and differing by >2 log2 units when comparing the 4 most sensitive (pink bar) and 4 most resistant (cyan bar) NSCLC cell lines (horizontal axis).

