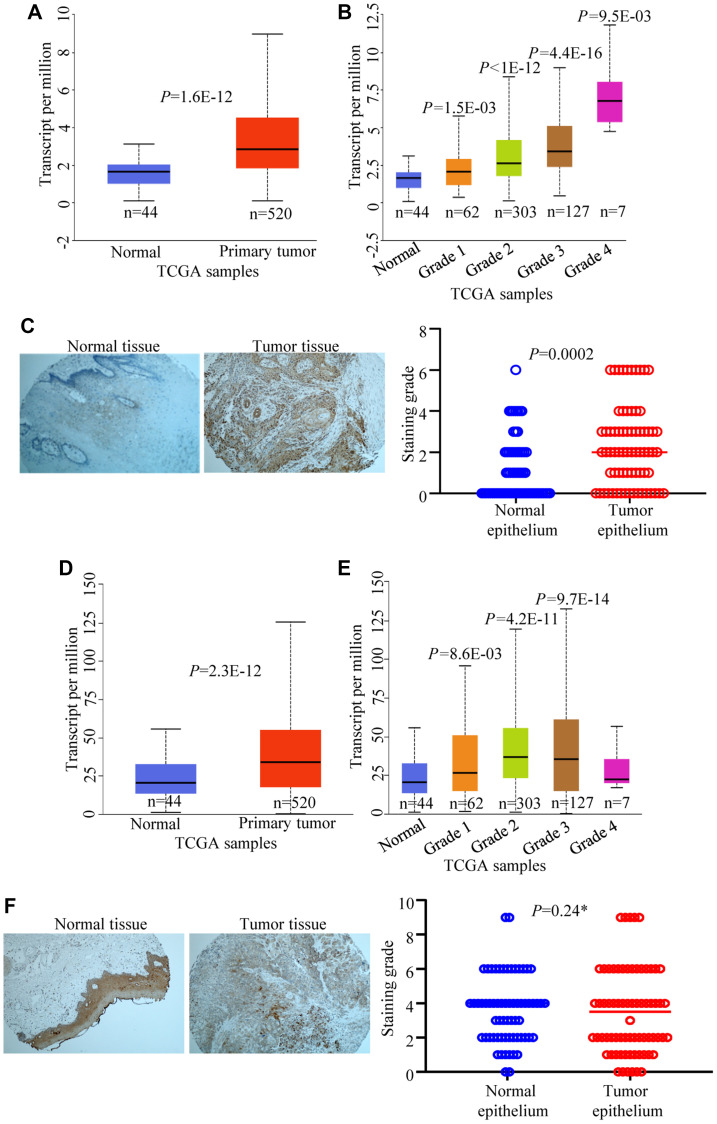
Figure 6. CPAP and EGFR expression levels in HNSCC and normal tissues.
TCGA data set was analyzed using UALCAN for CPAP mRNA expression and comparisons were made between head and neck normal tissues with primary tumor tissues (A) and different tumor grade subgroups (B). Immunohistochemistry of head and neck cancer TMA slides containing tumor tissue and adjacent normal tissue sections was carried out for CPAP protein expression using anti-CPAP antibody (C). Images of staining examples of normal and tumor tissues (left) and mean staining intensity grades of tumor and adjacent normal epithelia (right) are shown. TCGA data set was also analyzed for EGFR mRNA expression and comparisons were made between normal tissues with primary tumor tissues (D) and different tumor grade subgroups (E). TMA staining was performed using anti-EGFR antibody (F) and the images of staining examples (left) and mean staining intensity grades (right) are shown. All P-values are by two-tailed, unpaired Student t-test (normal vs primary tumor for panels A and D; normal vs specific grade for panels B and E; normal epithelium vs tumor epithelium for panels C and F). *denotes not significant.

