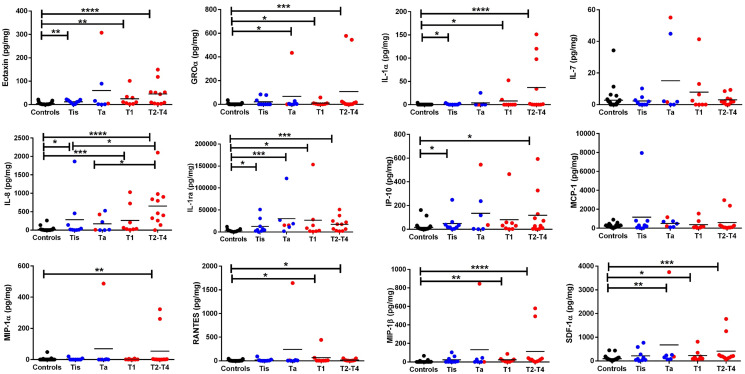
Figure 1. Luminex based screen of 16 urine proteins in bladder cancer.
The dot plots depict the 12 proteins that were detectable by Luminex assay either in BC urine or the urology clinic controls, labeled as “Controls”. Tested samples included 31 controls, 7 Ta, 9 Tis, 8 T1, and 11 T2–T4 urine samples. Creatinine normalized urine protein levels are shown in different colors specific for each group (black dots = controls, blue dots = low grade BC, and red dots = high grade BC). Low grade tumor and high grade tumor classification was based on pathology reports. The asterisks designate the level of significance between the different groups: * = p < 0.05, ** = p < 0.01, *** = p < 0.001, and **** = p < 0.0001, using a Mann Whitney U test. The primary data for this analysis is presented in Supplementary Table 2. All controls used for this study were drawn from the Urology clinic, including patients investigated for hematuria but found not to have any urological cancers.

