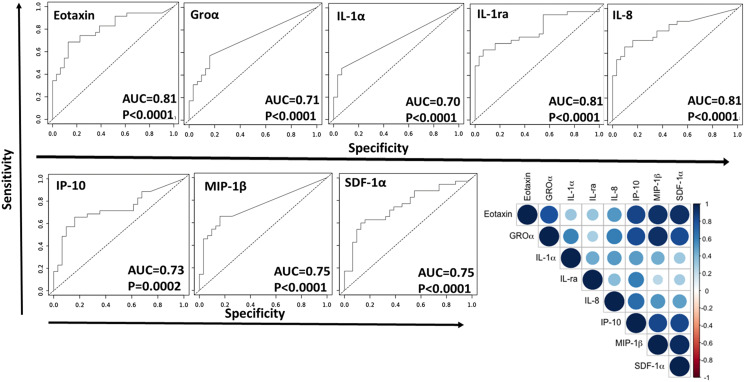
Figure 2. Eight urine proteins that discriminate BC from controls based on the Luminex-based screen of 16 proteins.
Receiver Operating Curve Area Under Curve (ROC-AUC) plots were generated for eight urine proteins including Eotaxin, GROα, IL-1α, IL-1ra, IL-8, IP-10, MIP-1β, and SDF-1α to determine their ability to discriminate BC from controls. AUC values and p-values are listed on each curve. The closer the AUC value is to 1, the higher the discriminatory potential of the protein to distinguish between the two groups, with maximized specificity and sensitivity. All of the proteins exhibited AUC values of 0.70 or higher, with p-values < 0.0001, except IP-10 which had a p-value of 0.0002. A correlation plot was also generated for these eight urine proteins. Each circle represents the degree of correlation for the given protein pair, with blue intensity corresponding to positive correlation and red intensity corresponding to negative correlation.

